Browse Database
To access records from PTM-SD, the database can be browsed using 2 search modes according to different filters; the
Simple and the
Advanced Mode.
The filters in
Simple mode are:
| P D B - I D | You can specified one or a list of PDB id code separated by semicolon. This filter is not case sensitive (Ex: 1fzc;1FZG;1Lt9). |
| U n i P r o t - A C | You can specified one or a list of UniProt AC separated by semicolon. This filter is not case sensitive (Ex: P00396;P06008;P0C1V1). |
| O R G A N I S M | Select among the list of organism (UniProt species identification codes followed by common name or, whether missing, by official scientific name). |
| P T M | Select among the list of Post Translational Modification annotations. |
Press Ctrl and Shift key to deal with individual and multiple selection.
For more complex filters use the advanced mode (see below).
Search
By clicking in the
Search button you request Database as follow:
Each selected values in same filter category are treat with the "
OR" operator.
Each filter categorie are treat with the "
AND" operator.
So for example by filter records like this :
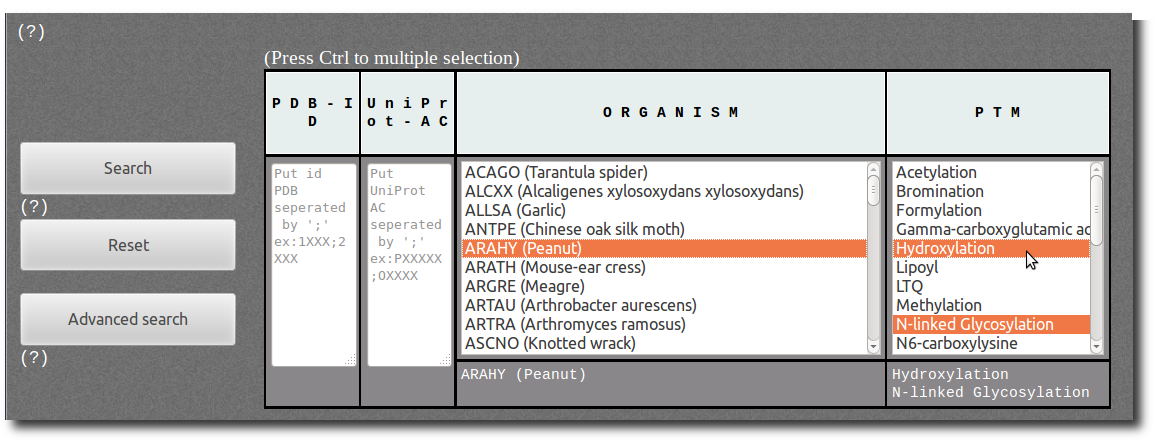
It will request records corresponding to the ARAHY (Peanut) organism "
AND" corresponding to PTMs N-linked Glycosylation "
OR" Hydroxylation.
Request traduction:
"All records corresponding to N-linked Glycosylation and Hydroxylation in Peanut organism."
Advanced search
To pass in Advanced Mode click on the
Advanced search button.
By using Advanced Mode you can add more detailed and specific filters for your request:
| MODIFIED AMINO ACID | Modified amino acid type ( = the residue type found at the PTM site position in the UniProt sequence). |
| SECONDARY STRUCTURE ON PTM LOCATION | Secondary structure assignment at the PTMs positions. The secondary structure is assign by DSSP, and the corresponding output "letters" are :
| B | residue in isolated beta-bridge |
| C | loop or irregular |
| E | extended strand, participates in beta ladder |
| G | 3-helix (3/10 helix) |
| H | α-helix |
| I | 5 helix (pi helix) |
| T | hydrogen bonded turn |
| S | bend |
|
| SCOP CLASSIFICATION OF PROTEIN | The Structural Classification Of Proteins (SCOP). By using this filter, you can restraint your search to specific structural classes of proteins.
The different classes available in PTM-SD are:
| a | All alpha proteins |
| b | All beta proteins |
| c | Alpha and beta proteins (a/b) |
| d | Alpha and beta proteins (a+b) |
| e | Multi-domain proteins (alpha and beta) |
| f | Membrane and cell surface proteins and peptides |
| g | Small proteins |
| h | Coiled coil proteins |
| i | Low resolution protein structures |
| j | Peptides |
| None | No yet classified by SCOP |
|
| Number of PTM by pdb_chain | Defined the number of PTM sites found on the same PDB chain. |
| Length of pdb_chain | Defined the length of the PDB chain in which the PTM sites are found. It is possible to take or don't take into account the number of missing residues on the chain. |
| ANNOTATION FOUND IN MODRES PDB RECORDS | MODRES comment found in the PDB structural files selected to build PTM-SD.
The MODRES record provides descriptions of macromolecule modifications found in structure; its generated by the wwPDB, and could be related to chemical, engineering, or post-translationnal modification. |
| ANNOTATION FOUND IN dbPTM | The dbPTM PTM annotations. Its correspond to the detailed ones from the downloadable data for experimentally verified PTM sites.
By selecting value in this filter you request for specific PTM annotations.
However these annotations could not correspond to the PTM found in the cristal structure. For more clarification see the examples below. |
To come back to Simple Mode click on the
Hide advanced search button.
Note: your selection in Advanced Mode will be deselected by returning to Simple Mode.
Some examples to understand how to use the
ANNOTATION FOUND IN dbPTM advanced filter:
| First a simple example of search.
By selecting Acetylation in the PTM filter,
you can search for:
"All records corresponding to Acetylation".
There are (on January 2014) 93 corresponding modified residues
both structurally resolved in PDB structures
and experimentaly annotated in dbPTM. | 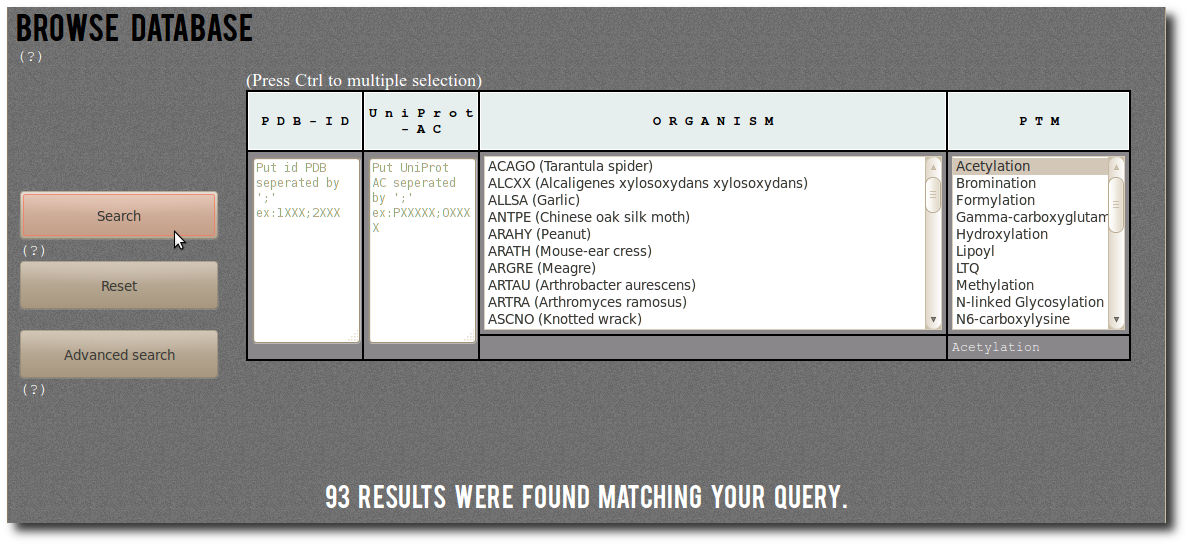 |
|
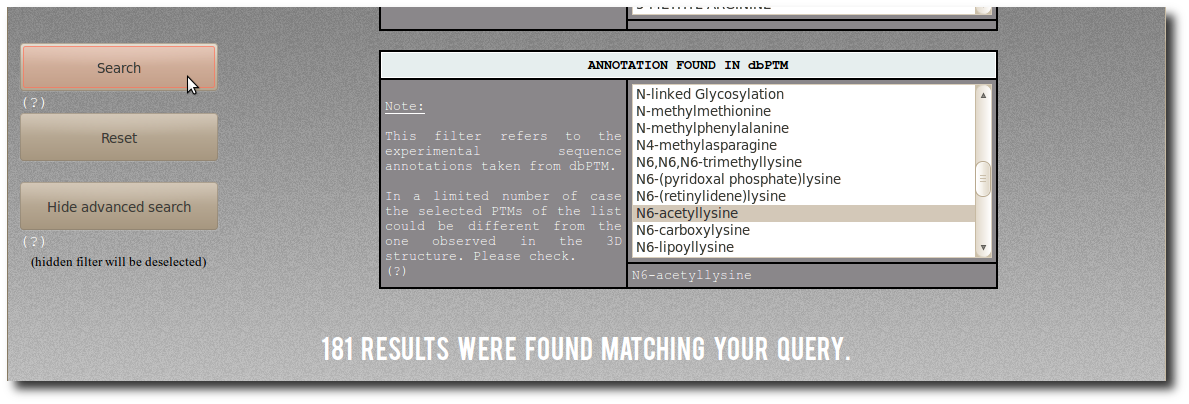
By selecting "N6-acetyllysine"
in the abvanced filter dbptm_annot, you can search for:
"All records for which there is 'N6-acetyllysine'
in the dbPTM annotation.".
There are (on January 2014) 181 corresponding modified residues
both structurally resolved in PDB structures
and experimentaly annotated in dbPTM.
As you can see there is more corresponding entries than in the previous example,
in which the search was made for Acetylation entries.
It is important to understand that the position of one PTMs site both
structurally resolved and experimentaly annotated could
also correspond to the position of other PTM annotations.
See the N-TRIMETHYLLYSINE found in the Chain B of PDB 3N9L;
This PTMs site are annotated in dbPTM as N6,N6,N6-trimethyllysine
but also as N6-acetyllysine.
|  |
|
So by using both simple and advanced filters,
it is possible to make some specific request.
Thereby selecting Acetylation in the PTM filter,
and "N6-acetyllysine" in the abvanced one dbptm_annot,
you can search for:
"All records corresponding to Acetylation,
on which there is 'N6-acetyllysine' in the dbPTM annotation.".
This could be traduct as "All N6-acetylation of lysine both
structurally resolved and experimentaly annotated".
There are (on January 2014) 83 corresponding entries in PTM-SD. | 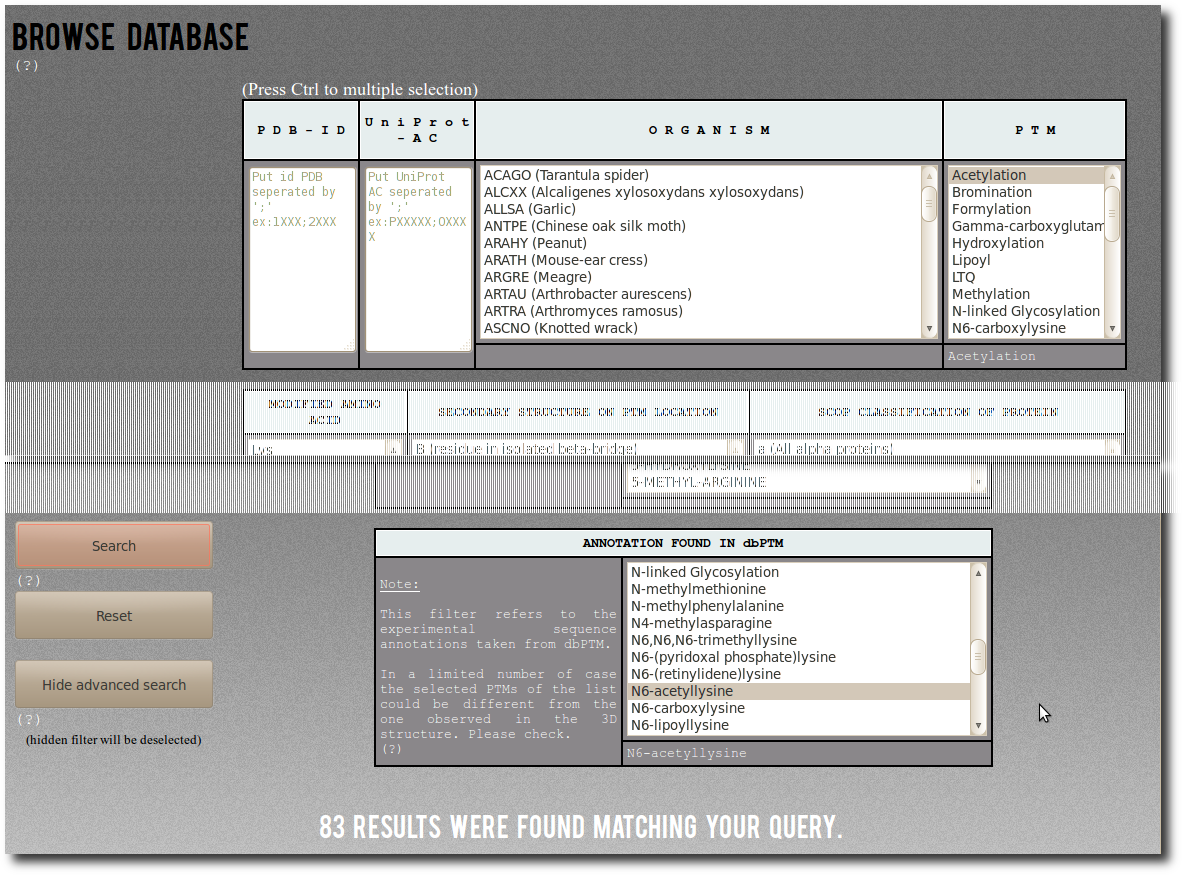 |
Result table
By clicking on the
Filter button, the search results display below the filter table.
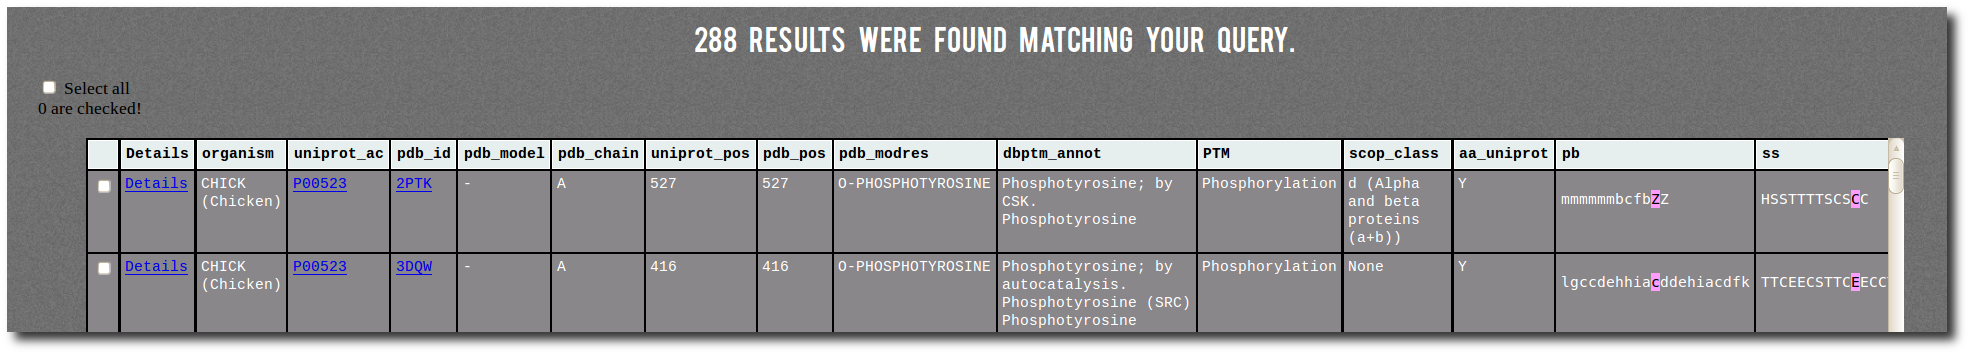
The result table contains one line for each corresponding PTM site from PTM-SD.
It contains several information:
| Details | a link on the PTM-SD details page of the PTM site, |
| organism | the protein organism, |
| uniprot_ac | the UniProt AC with a link on the UniProt page of the protein, |
| pdb_id | the PDB id Code with a link on the PDB page of the structure, |
| pdb_chain | the PDB id Chain, |
| uniprot_pos | the position of the PTM site in the UniProt sequence, |
| pdb_pos | the position of the PTM site in the PDB structure, |
| pdb_modres | the PDB MODRES comment related to the PTM site, |
| dbptm_annot | all the dbPTM annotations related to the PTM site position in the protein, |
| PTM | the general annotation of the PTM site, |
| scop_class | the structural classification of the protein from SCOP, |
| aa_uniprot | the amino acid type of the PTM site position in the UniProt sequence, |
| pb | the local structure assignment (Protein Blocks) of -10/+10 positions surrounding the PTM site (highlighted in purple), |
| ss | the secondary structure assignment (DSSP) of -10/+10 positions surrounding the PTM site (highlighted in purple). |
Create your dataset
At any moment you have the possibility to donwload 2 kind of data corresponding to selected entries in the result table.
| List of the P D B - I D in which the selected PTMs are found. | A .csv style file containing the PTM-SD data of selected entries. |
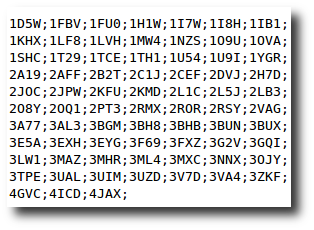 | 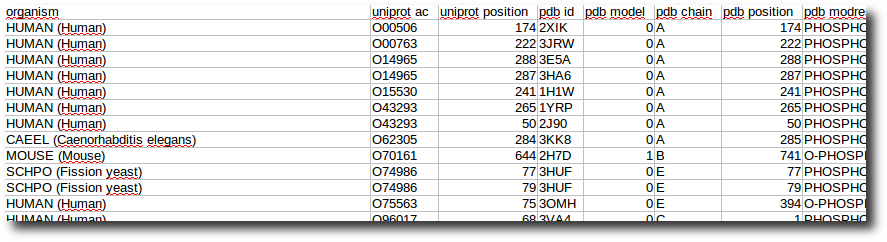 |
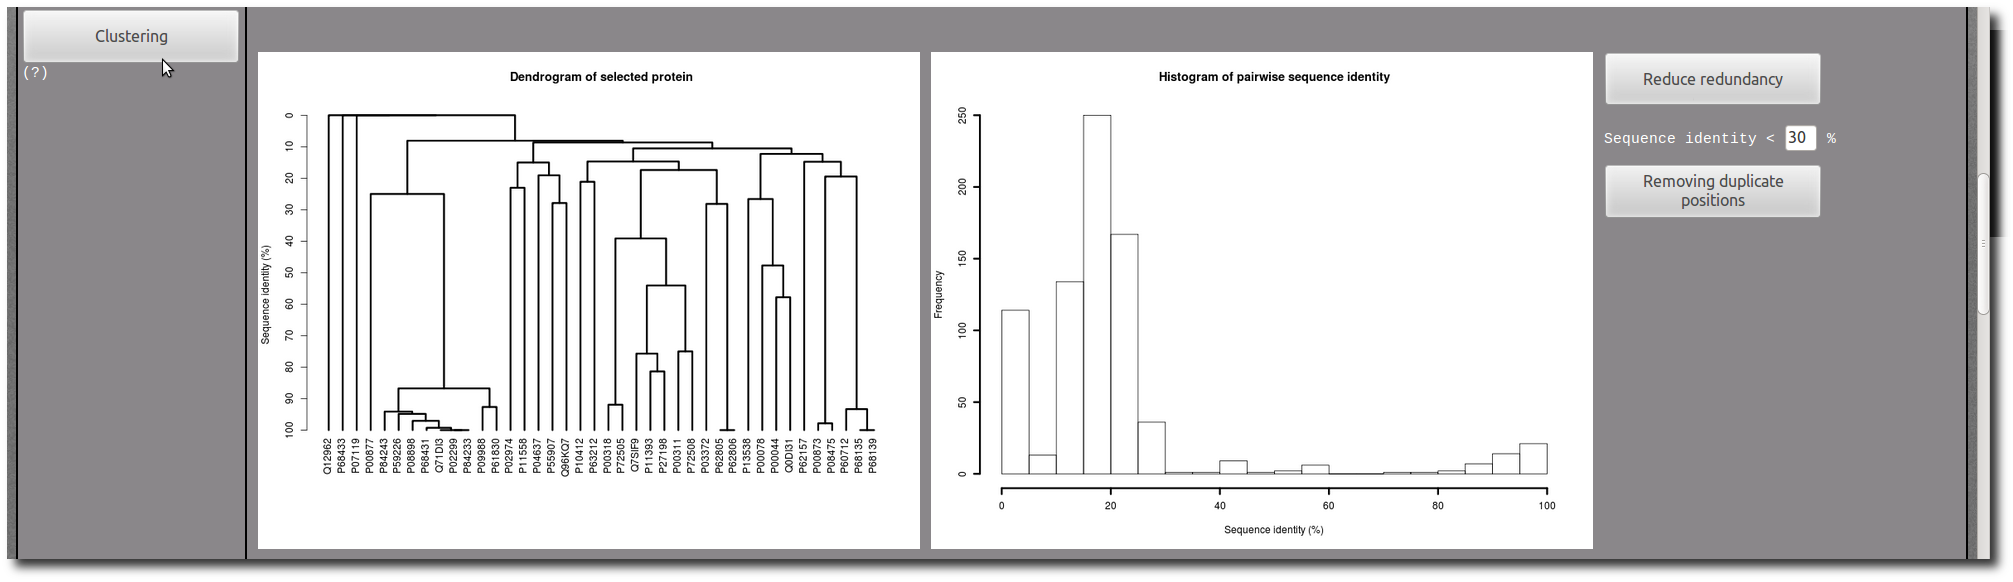
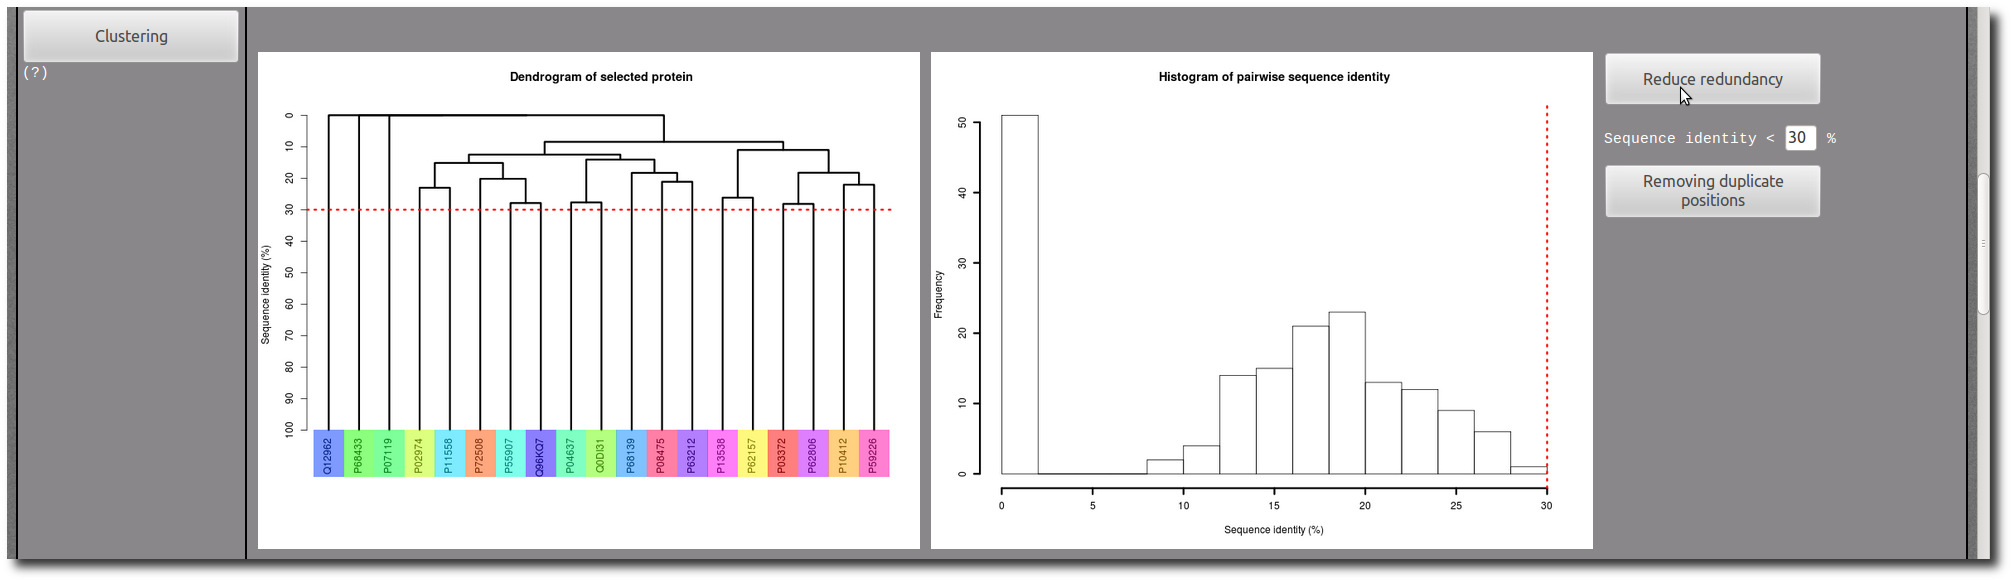
By using
Tools you have the possibility to create a non-redundant selection, and then create your own dataset.
To obtain it follow this 4 steps:
| 1 |
Request the database by using filters in the Browse Database section
|
| 2 |
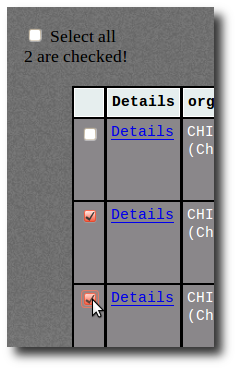
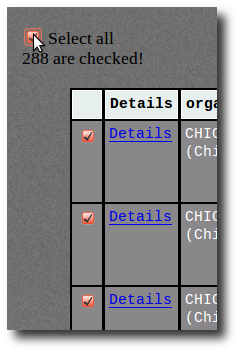
Select entries in the result table.
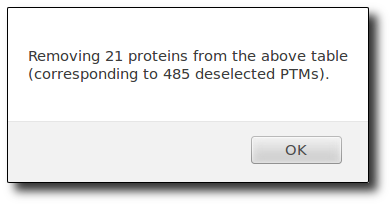
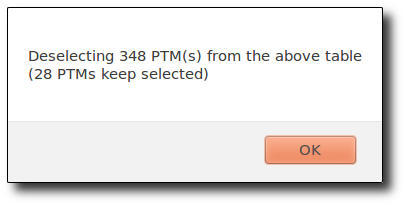
If needed, use the Clustering tool to reduce redundancy in your selection.
|
| 3 |
Go to CREATE YOUR DATASET section.
Click on the HERE button :
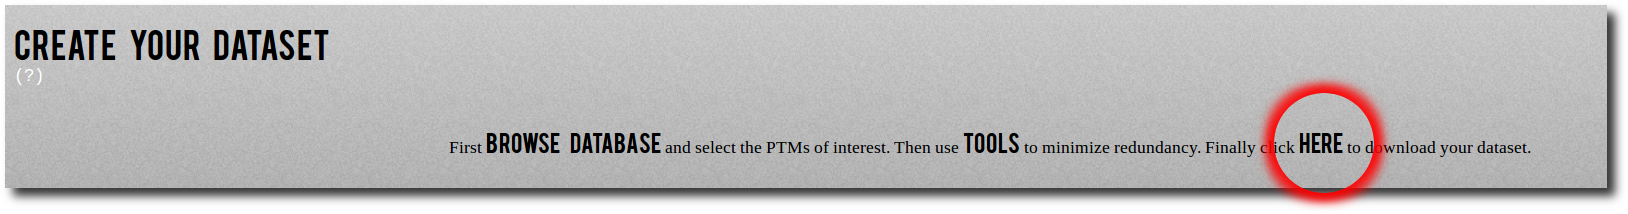
|
| 4 |
And follow the instructions that have just appear.
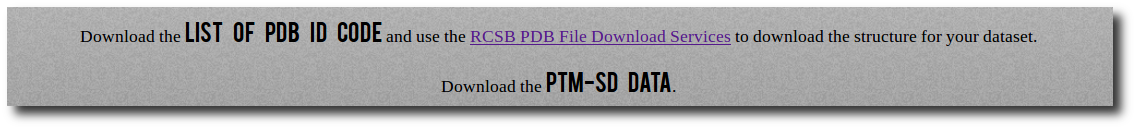
|
Gallery
In each PTM site "Details page", there are two images to illustrate the structure of the PTM site in context of the protein conformation.
The first one present an entire view of the PDB chain which contains the PTM site, and the second correspond to a zoom in the PTM site structure.
The current PTM site are colored in
purple, and the other PTM sites present in the same PDB chain are highlighted in
yellow.
This color code is the same in the aligned sequences below in the "Details page".
These two images were automatically generated with the
PyMOL software.
The PyMOL script used to obtain these images is downloadable at the bottom of the "Details page".
Note: As the images production is automatic, the focus on the PTM site could not be the most optimized.
In these cases it is recommended to use the PyMOL script to visualize the PTM site in 3D.
Alignment
The "Details" page of each PTM site provide an alignment table highlighting the sequence/structure relationships in the chain which contains the concerned PTM site.
This last includes an alignment of the protein amino acids sequence, secondary structure and local structure (Protein Blocks) assignments.
The PTM position corresponding to the current page is highlighting in
purple and the other PTM sites present in the chain are colored in
yellow.
The same color code is used in the images gallery.
The PTM positions found in other PDB structures are highlighting in
green.
Uniprot Sequence
The Uniprot sequence corresponds to protein sequence in which the PTM site is annotated.
Clustal
The sequences alignment were performed using
Clustal W (2.0.12).
The symbols for similarity/idendity of position, provide by Clustal W, were also aligned. They facilitate the observation of differences between the protein sequence from UniProt and the chain residues from the PDB.
PDB Sequence
This sequence corresponds to the chain residues found in the PDB file.
The amino acids are sorted according to the polypeptide bond order, from the N-termini to the C-termini.
The amino acids are in one letter code, and the 'X' label correponds to unnatural residues.
Note: This sequence could not corresponds to the fasta sequence which could be found in the related PDB page. Indeed, the fasta could not include residues insertions, mutations, ...
PDB Information
The PDB information sequence is a linear representation of the reccord type of the PDB file (
version 3.30).
A one letter code is used for each PDB chain positions, as follow:
| H | The residue is defined on the 'HETATM' PDB record.
"Non-polymer or other “non-standard” chemical coordinates, such as water molecules or atoms
presented in HET groups use the HETATM record type." |
| _ | The residue is defined on the 'ATOM ' PDB record.
"The ATOM records present the atomic coordinates for standard amino acids and nucleotides." |
| I | The residue is numeroted as an inserted residue.
"Alphabet letters are commonly used for insertion code. The insertion code is used when two
residues have the same numbering. The combination of residue numbering and insertion code
defines the unique residue." |
| M | The residue is defined in the 'REMARK 465 MISSING RESIDUES' PDB record.
"REMARK 465 lists the residues that are present in the SEQRES records but are completely absent
from the coordinates section." |
| S | The residue is defined on the 'SEQADV' PDB record.
"The SEQADV record identifies differences between sequence information in the SEQRES records of
the PDB entry and the sequence database entry given in DBREF." |
As some positions could cumulate these information, the following hierarchical relation is used to choose the one letter representation:
M >
S >
H >
I >
_
DSSP Sequence
This sequence correspond to the secondary structure assignment made by
DSSP. The
output "letters" are :
| B | residue in isolated beta-bridge |
| C | loop or irregular |
| E | extended strand, participates in beta ladder |
| G | 3-helix (3/10 helix) |
| H | α-helix |
| I | 5 helix (pi helix) |
| T | hydrogen bonded turn |
| S | bend |
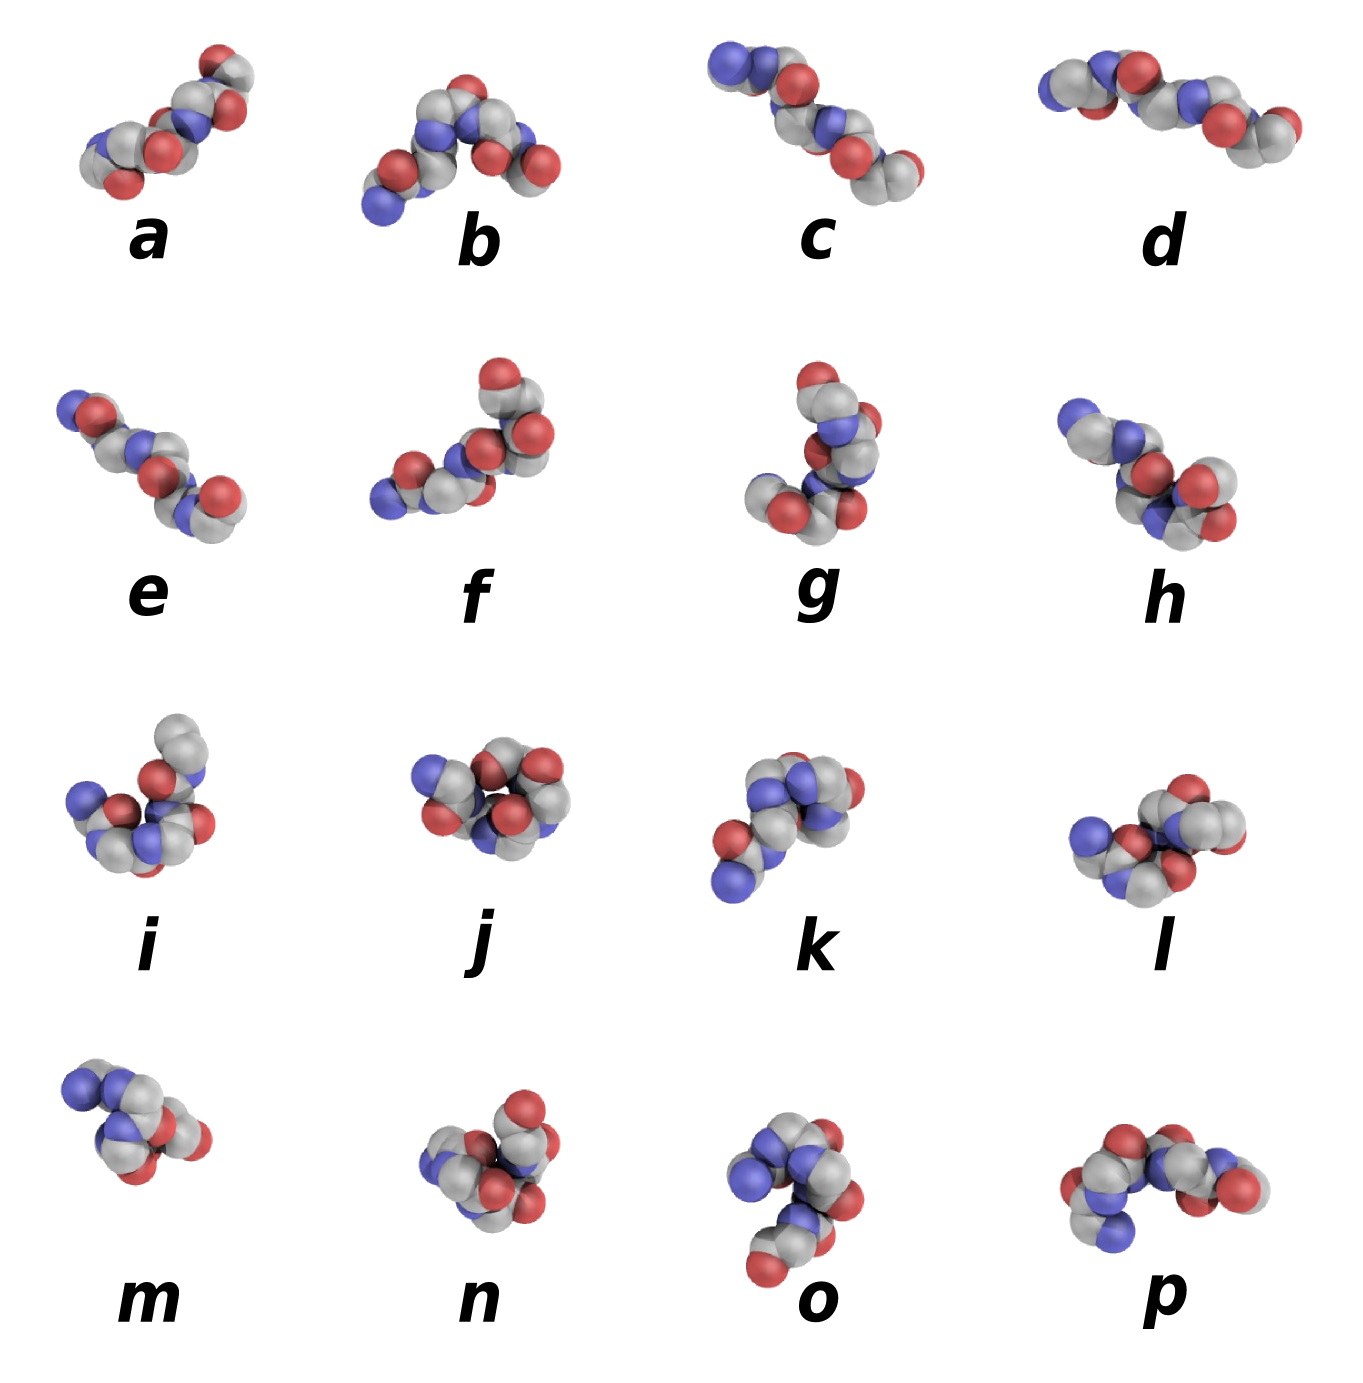
Protein Block Sequence
This sequence correspond to the Protein Blocks (PBs [
ref]) assignment made by a slightly modified Python
PBxplore tool.
|
This structural alphabet is composed of 16 local structure prototypes of 5 residues in length. They efficiently approximate every part of protein structures.
PBs m and d can be roughly described as prototypes for the central region of α-helix and β-strand, respectively;
PBs a through c primarily represent the N-cap of β-strand while e and f correspond to C-caps;
PBs g through j are specific to coils;
PBs k and l correspond to N cap of α-helix while PBs n through p to C-caps.
They have been used in various approaches, e.g. protein superimposition [ref, ref], protein binding site analysis [ref, ref] or prediction [ref, ref].
|
|
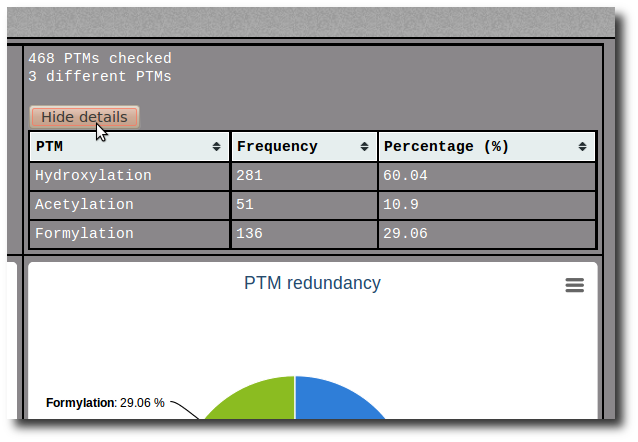
it was necessary to verify if the PTM annotations correspond to the chemical structure of the modified residue found at the same position. We use automatic and manual verification processes, which are based on the atom information extract from PDB files and a correspondence annotation table.
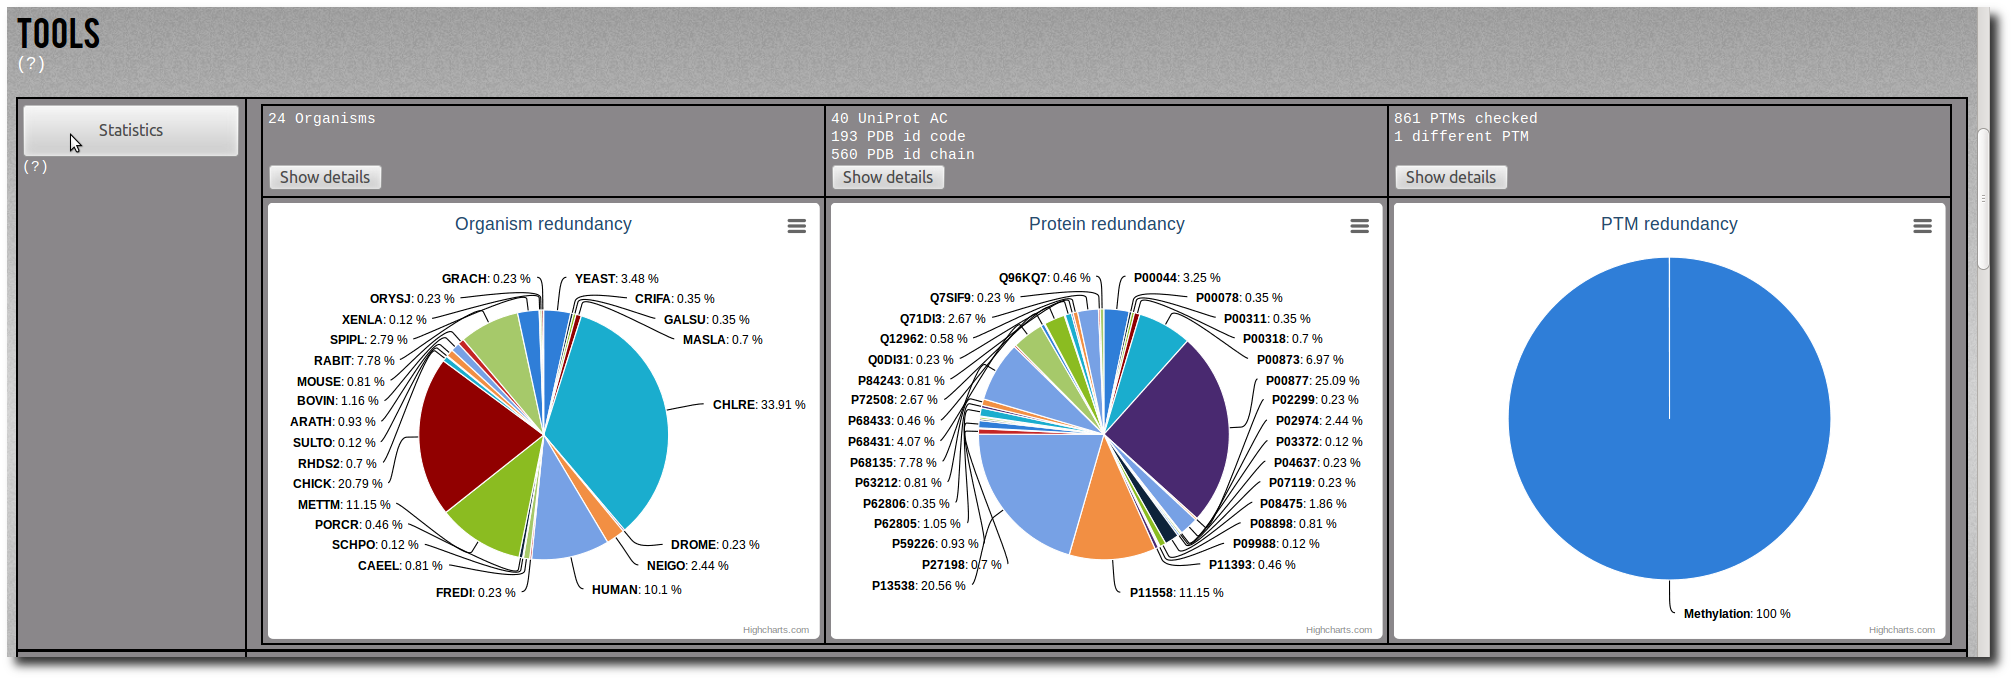
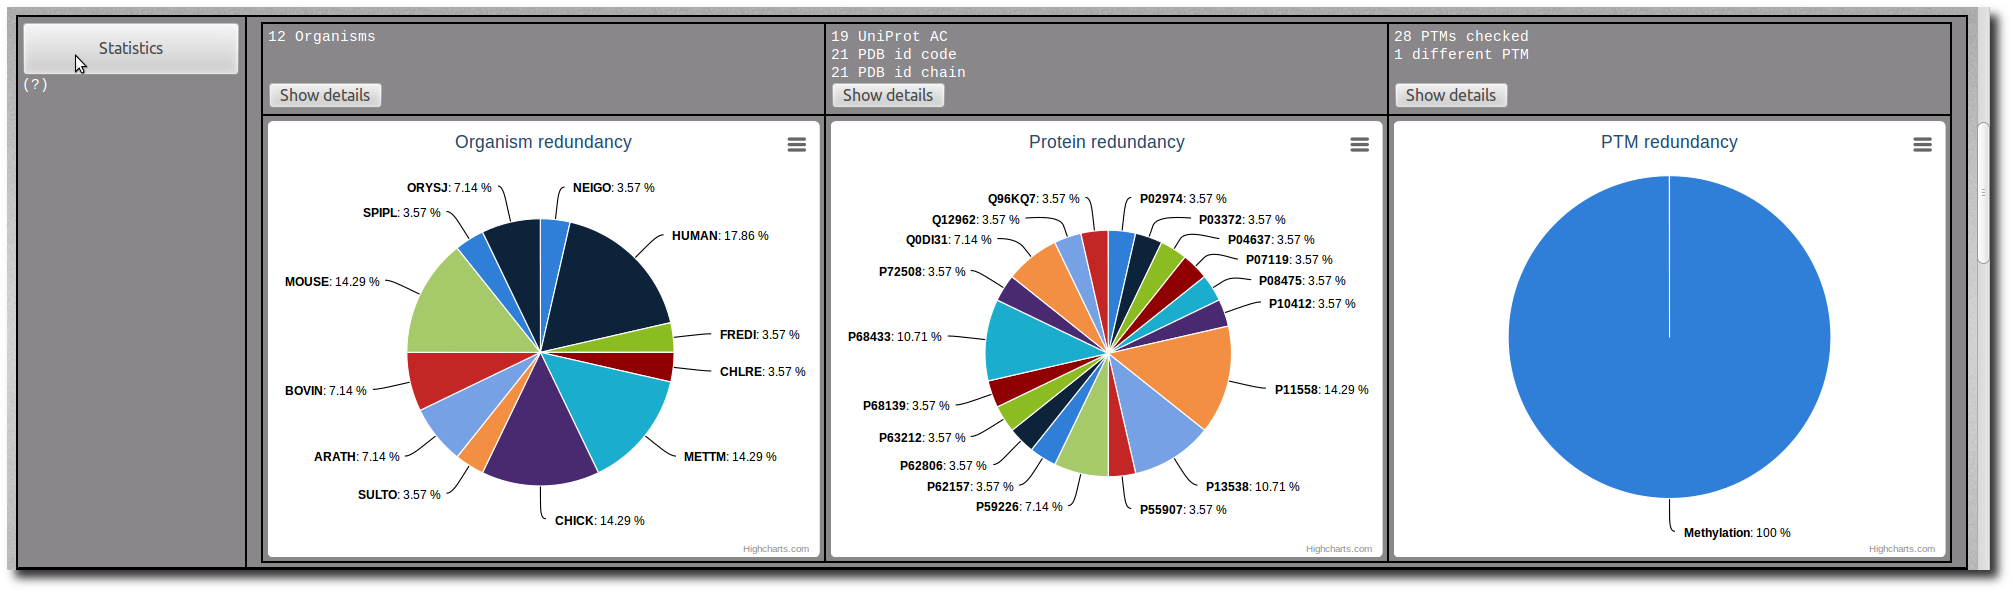
Click on the Show details button to display the raw data of the related pie chart.
The raw data are sortable by name, frequency or percentage.
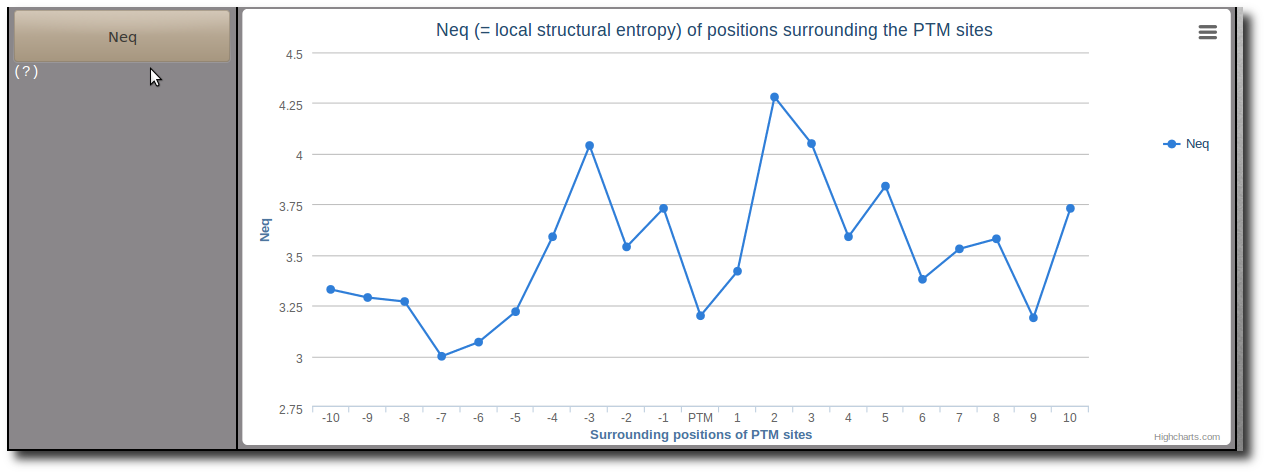
Where px is the probability of PB x. Note: A Neq value of 1 indicates that only one type of PB is observed, while a value of 16 is equivalent to a random distribution.