Introduction
mulPBA is an efficient method to superimpose multiple protein structures. Deriving an optimal superimposition of two protein structures (pairwise superimposition) is non-trivial; the difficulty in obtaining a Multiple Structural Alignment (MSA) is relatively higher. The main interest of mulPBA is its better performance in terms of alignment quality, when compared to other available methods (see ABOUT section for more details) and the minimal influence of 3D flexibility in 'sequence-like' alignments.
A-Superimposition
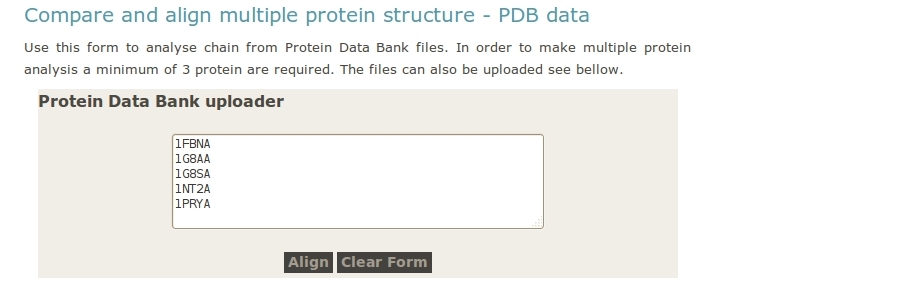
1- Front page
mulPBA takes at least 3 sets of coordinates of protein chains (in PDB format) and superimpose them.
Four options are given for input:
- directly using PDB files from local PDB databank based on user supplied PDB IDs.
- User upload PDB files.
- User upload archive with all the PDB files
One important point is not to forget to give the PDB chain identifier
- User can reload a previous analysis by supplying an analysis ID.
In the picture below, the analysis ID is highlighted in yellow.
2- Errors / computation
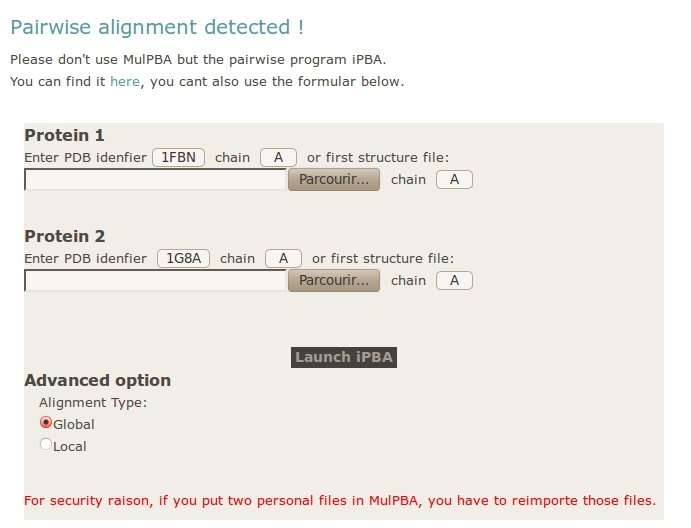
If only two structures or two files are provided, the computation stops. A new formular appear, you can use it to submit your data to iPBA webserver. If you used PDB ID in MulPBA, they will be provided; if you used personal files, you will have to import them again.
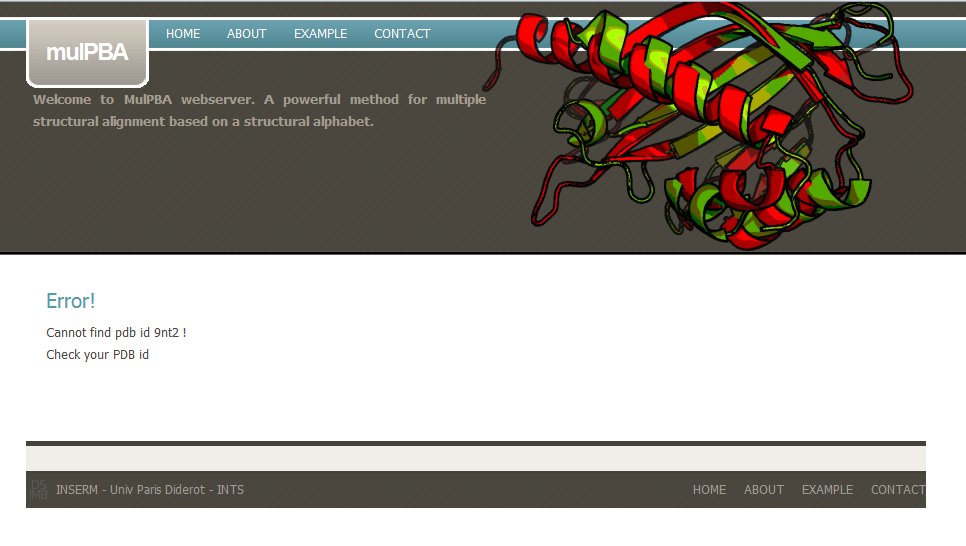
If the PDB is not found in the local PDB databank, mulPBA computation stops. For instance, in this example, PDB id 9nt2 does not exist.
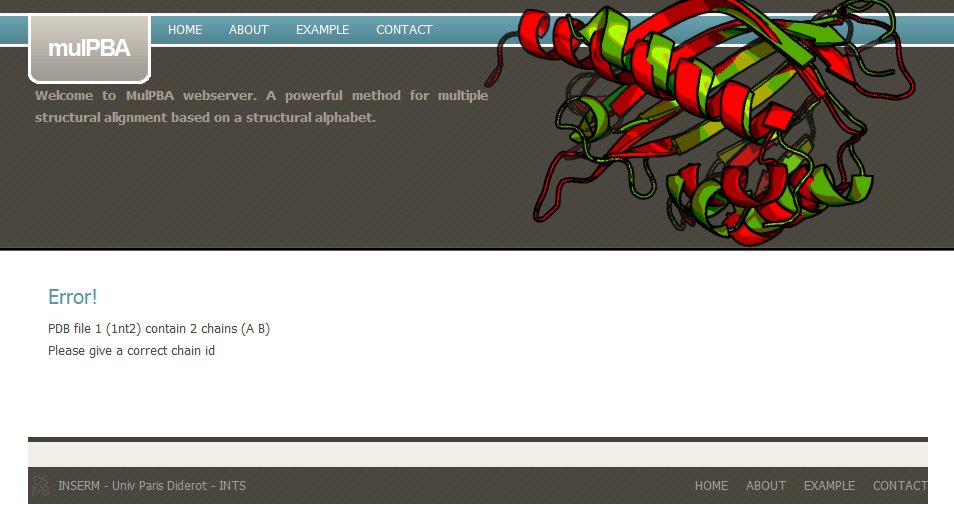
If a wrong PDB chain is given, mulPBA computation fails. For instance, in this example, PDB id 1nt2 has two chains and none has been selected.
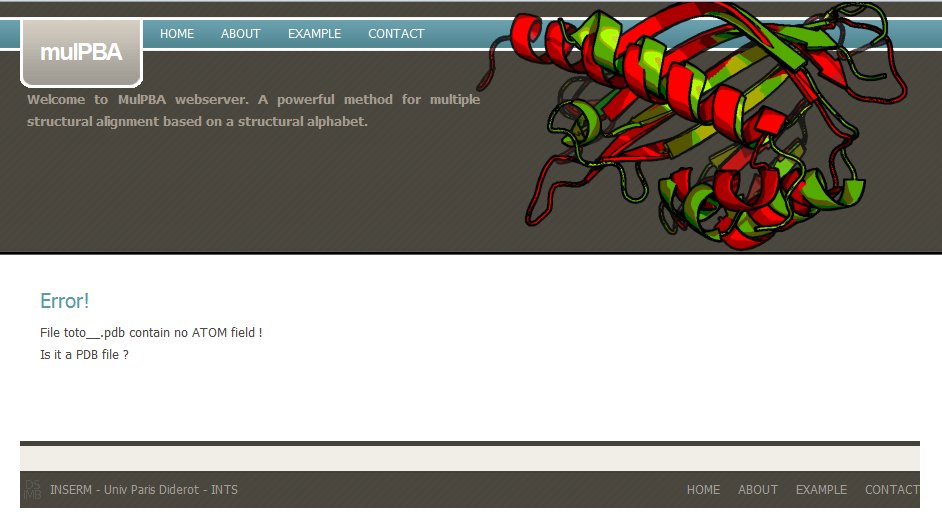
If the uploaded coordinate file is not a PDB file, mulPBA computation stops with a message : Please check your PDB file.
If the input files (or IDs) are valid, a message to wait till processing gets completed, is displayed.
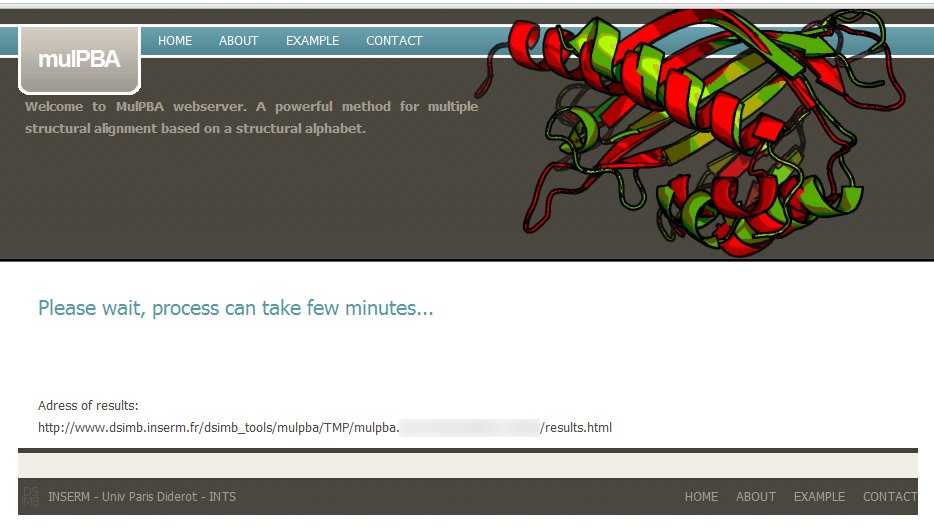
A dedicated url is also provided, you can copy it to come back later (results are kept for two month on the server).
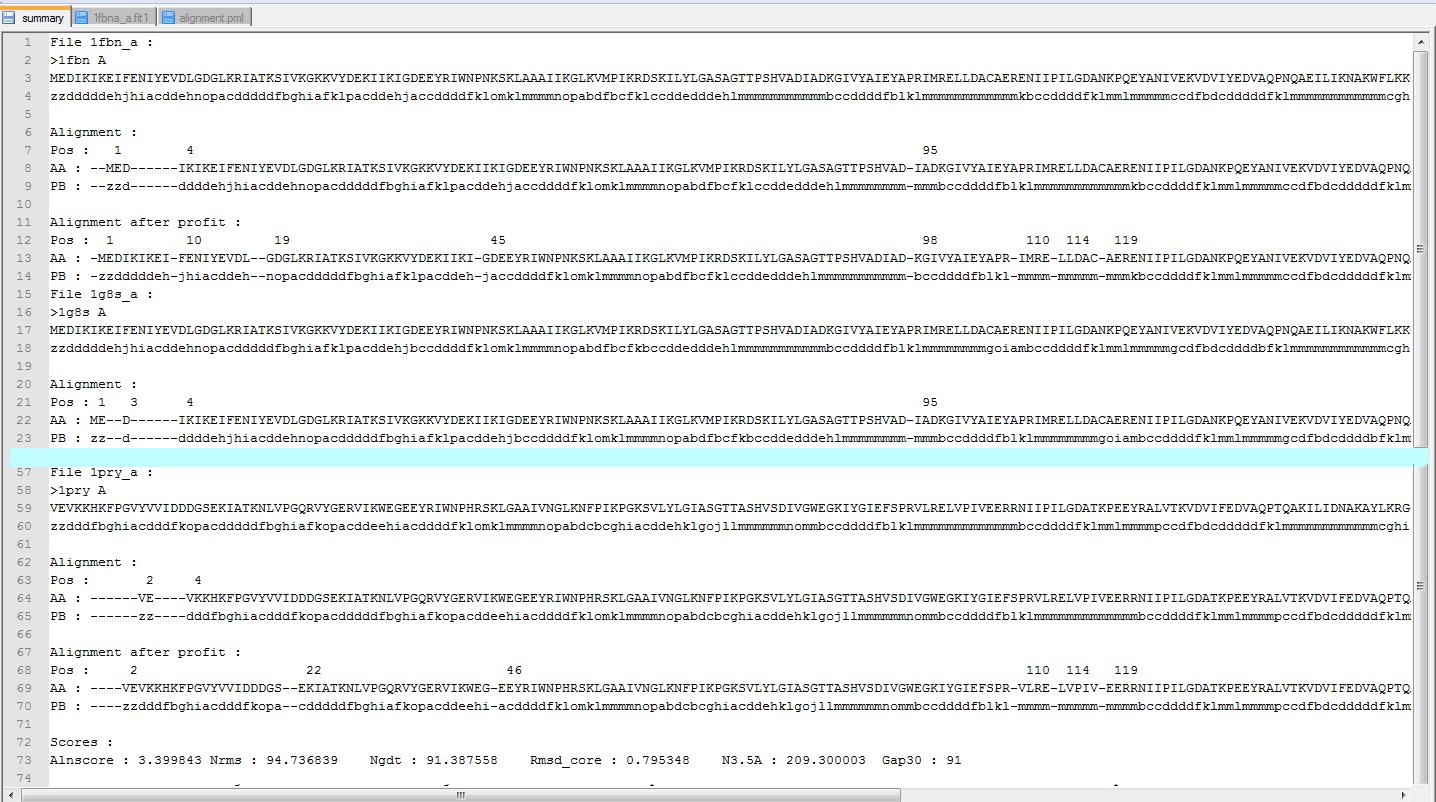
3- Results and Outputs
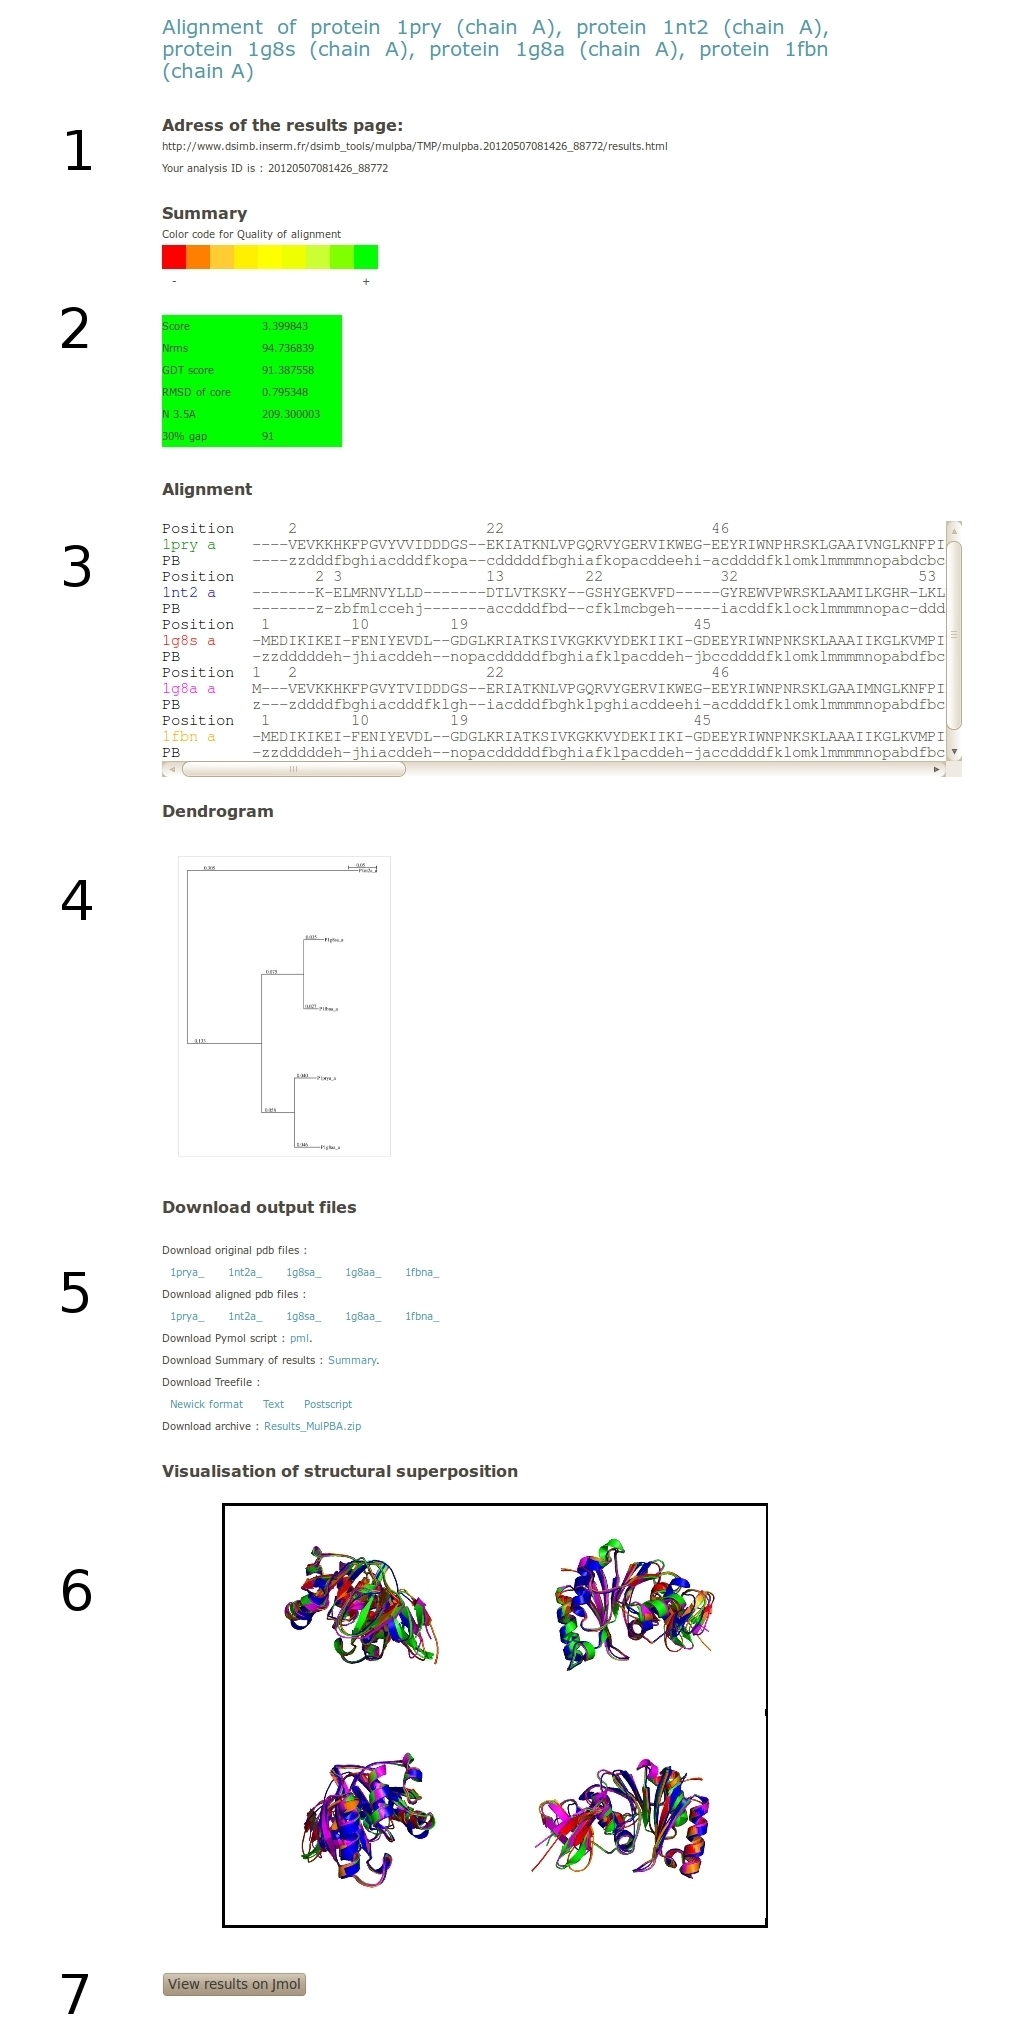
The output of the superimposition performed by mulPBA can be divided into 6 main parts:
1. The result address and analysis ID
2. The Alignment Summary.
3. The Alignment by itself.
4. The dendrogram.
5. The downloadable alignment files.
6. The PyMol images for visualization of 3D fit.
7. The JMol applet for interactive view of superposition.
We will describe the different part of the outputs:
1. Result address and analysis ID.
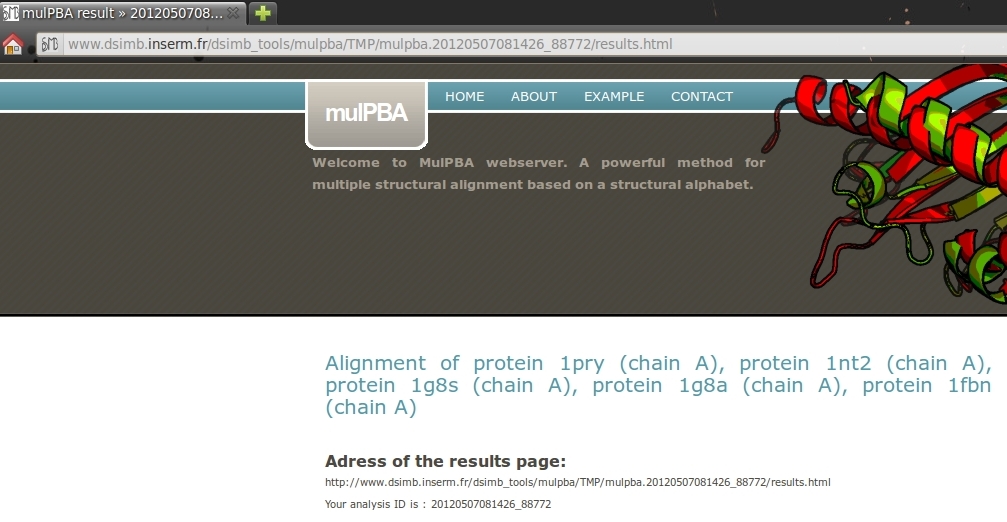
This part display the complete HTML address for your results and your analysis ID. To improve the visualization, note that the title of the page move from mulPBA web server to mulPBA result >> YOUR ANALYSIS ID
2. The Alignment Summary.
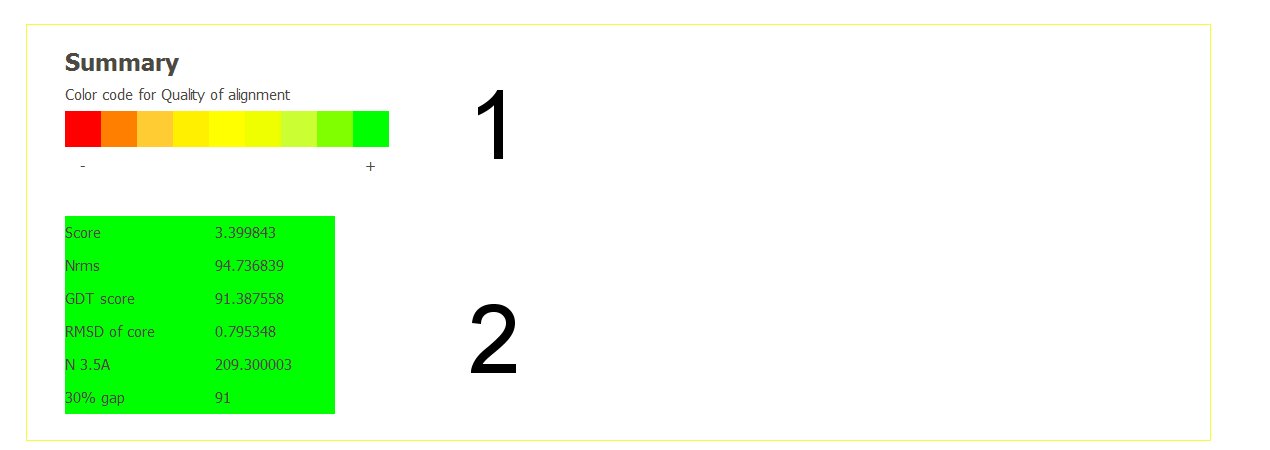
The important results are given in the upper part. (1) a color gradient (red to green) highlights the significance/quality of the alignment. Red color stand for a very poor similarity, green indicates a very close relationship (in terms of protein 3D structures, sequence identity could be quite divergent).
2) provides quantitative value to underline the quality of the alignment, with the alignment score, the Nrms, GDT score, RMSD of core, N3.5 (see About for more details). In this example, Nrms is quite good with 94.7 as a low RMSD of the core (0.79 A), this group has highly related protein folds. As expected, N3.5 is also high.
3. The Alignment.
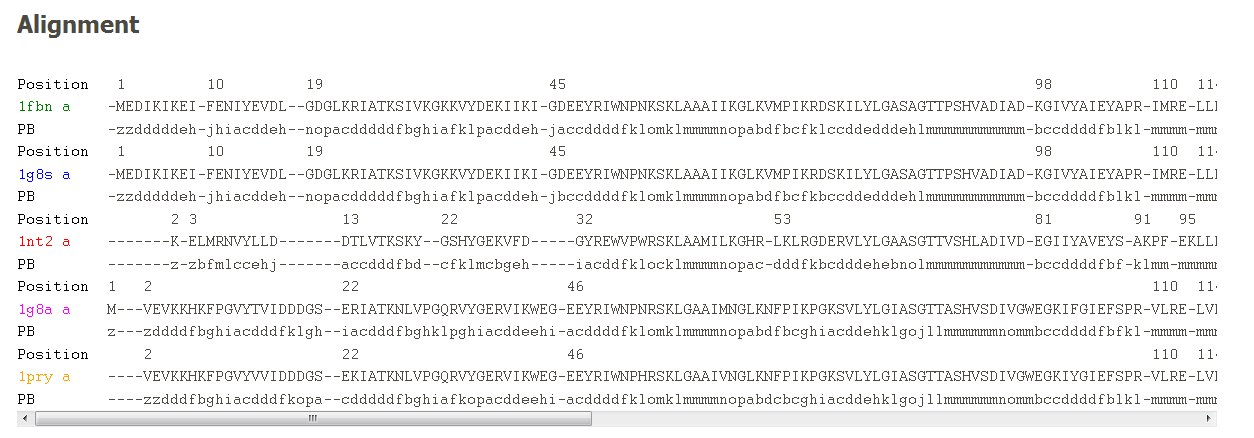
The amino acid sequence alignment is given with the corresponding PB assignments. The first protein chain is in green. A scrollbar allows seeing through the complete alignment length. Please notice that the colors assigned for each protein are valid throughout (see visualization part).
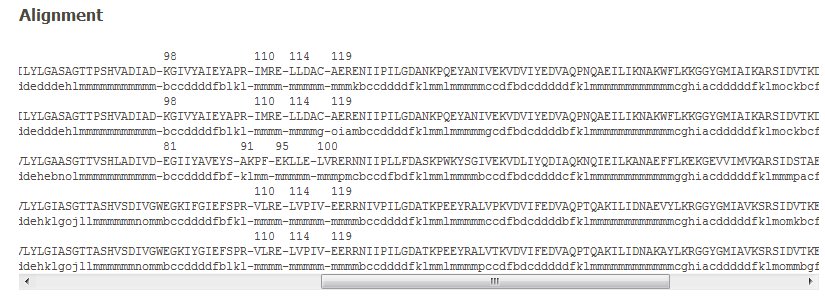
Please notice that PDB residue positions are also given. It is quite helpful to follow the residue equivalences of different proteins.
4. The Dendrogram.
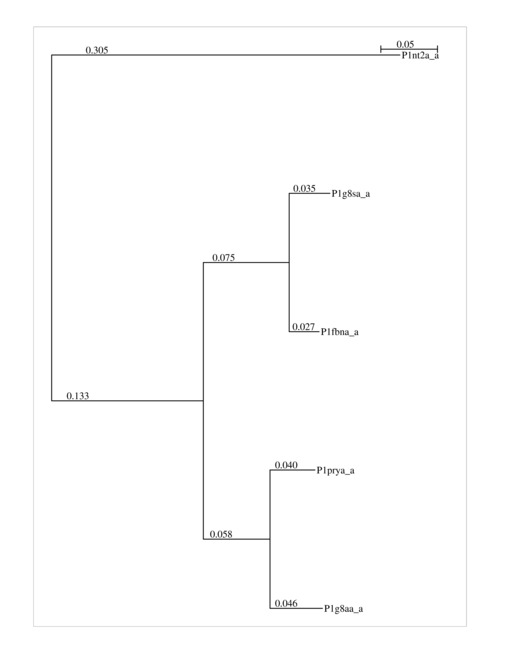
As the MSA approach of mulPBA is based on an aggregative clustering, a dendogram tree of most related proteins is used to start the alignment. The dendrogram is given here. It can be helpful in generating more reliable alignments after removing outliers (i.e., distant from the others). Here, it is the upper one (1nt2) which is distant from the main cluster.
5. The downloadable files.
Apart from the nice server outputs on the structural alignment, it is also interesting to have access (i) to the alignment flat file that can be used for further analysis and (ii) to files (PyMol) that allows regeneration of alignments with nice rendering. This file also allows accessing the initial PB alignments which are quite relevant for comparisons of structures involving flexible movements (eg: 1rtjA, 1dloA, 1rtdA).
In this section, you can have access to (i) The original protein files.
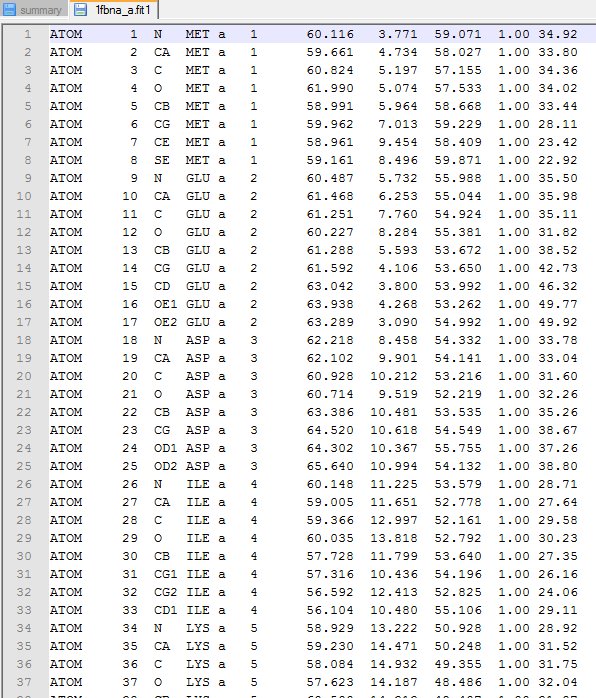
(ii) The superimposed PDB files. [click here to download the example files : 1 2 3 4 5]
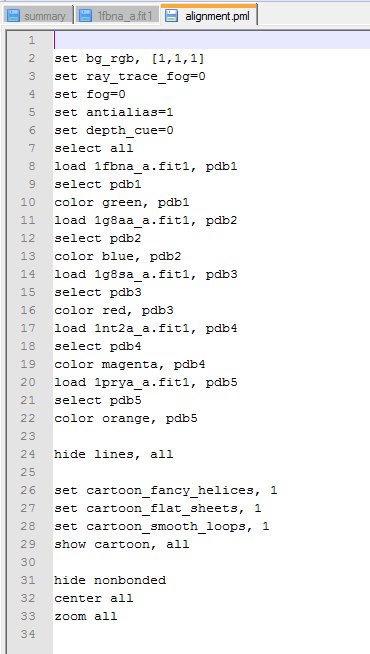
(iii) The PyMol script (see next section) [alignment.pml]
(iv) The Summary of all the results including the PB sequences of proteins used to obtain final MSA, with original amino acid numbering and different alignment Scores. [summary] (v) The different tree files with (a) the tree text file in Newick format [Newick], (b) as text [text tree] as in the summary and (c) the Poscript version [Postscript tree]
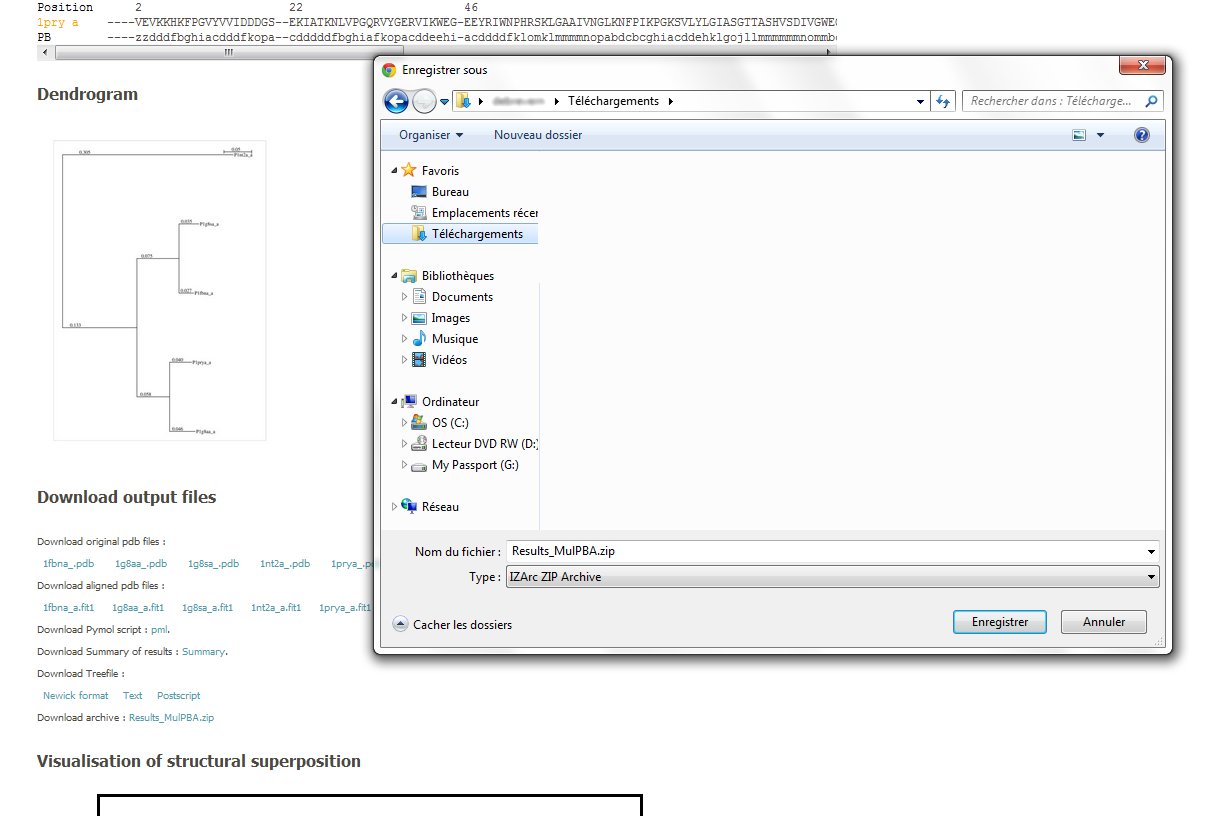
(vi) Finally a zip archive of all the above data is also provided.
example.zip
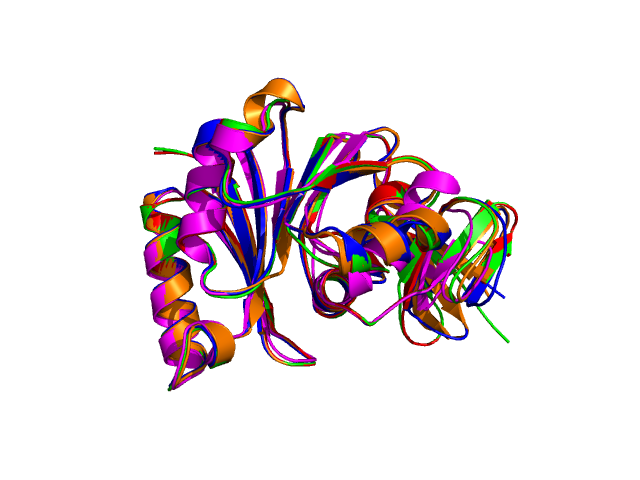
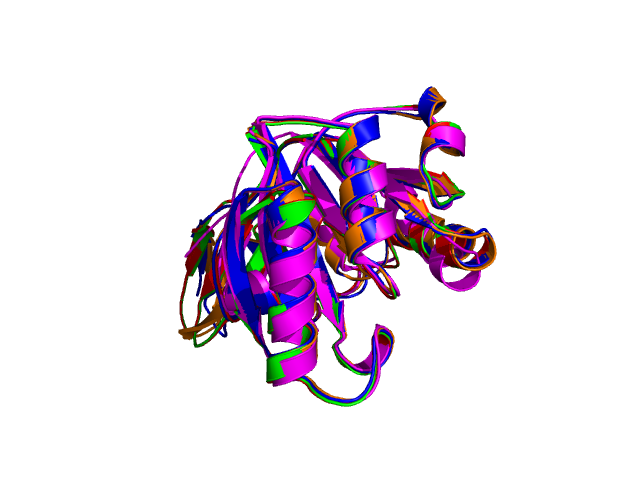
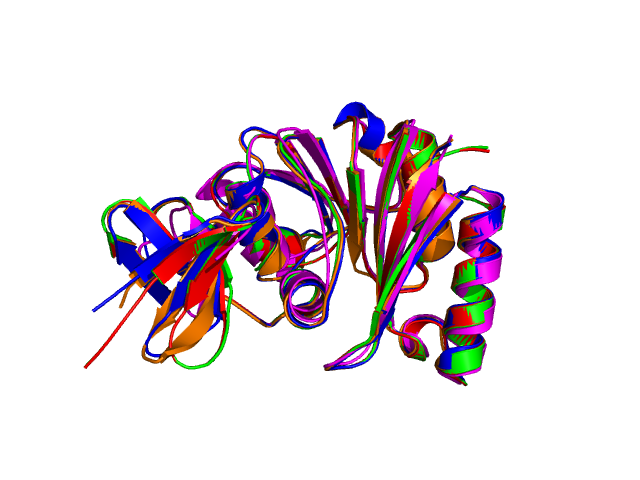
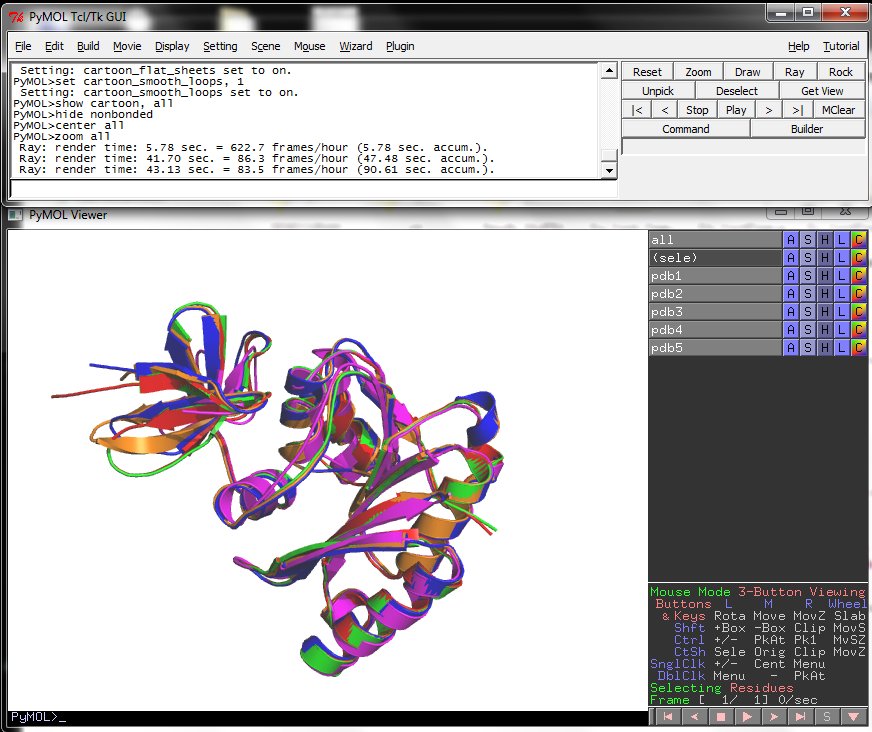
6. The PyMol images.
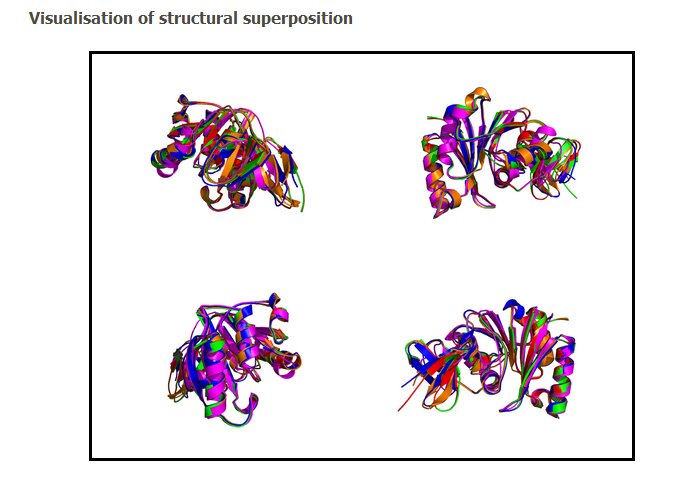
Four different views of the superimposed structures are given with rotations of 0°, 90°, 180° and 270°:
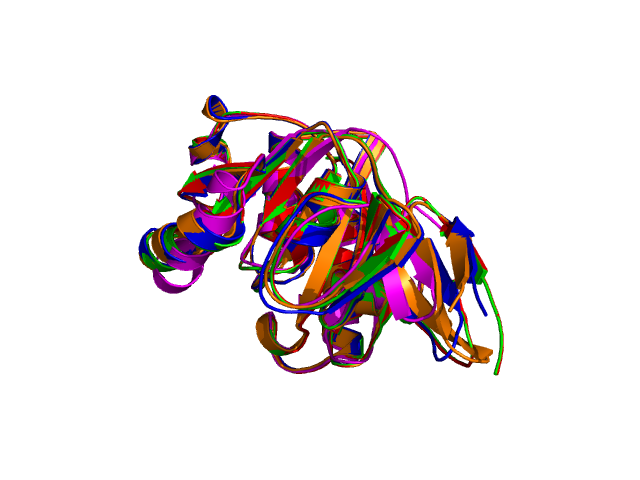
Using the downloadable PyMol script, it is also possible to (a) visualize the superposition with local PyMol program (ii) highlight equivalent residues or perform different rendering: With the PyMol script, it is simple to look at the superimposed structures.
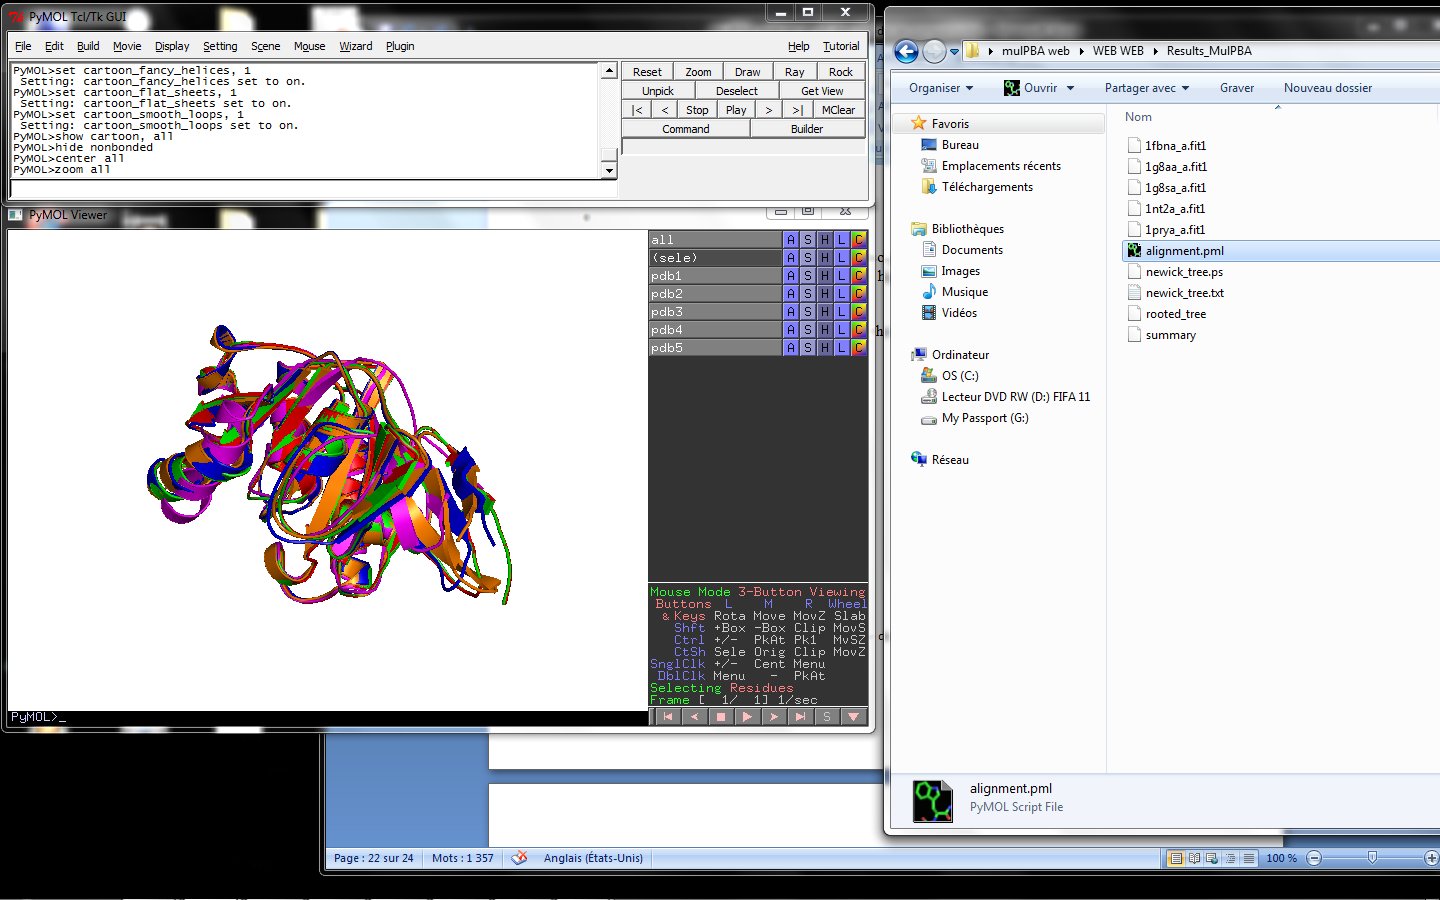
PyMol on your personal computer.
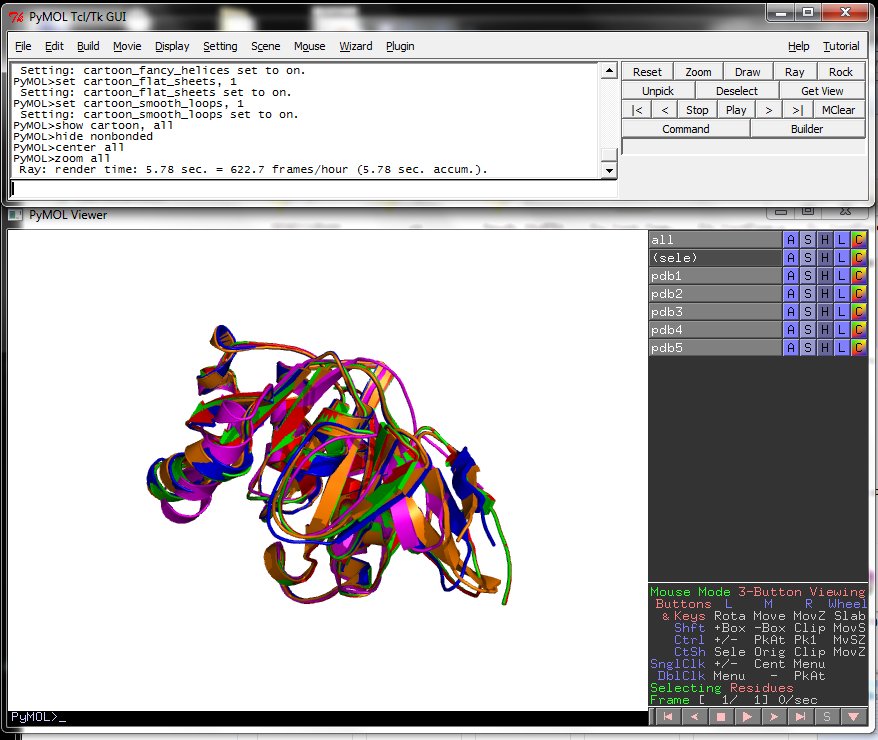
One ray tracing example.
7. The JMol applet superimposition.
PyMol gives very nice rendering, but you can have an interactive visualization of 3D superposition with the JMol applet. This applet needs to have Java installed.
By default, the Jmol applet isn't loaded. To load it, you just have to push the button "View results on Jmol".
Default rendering (cartoon).

Backbone rendering.
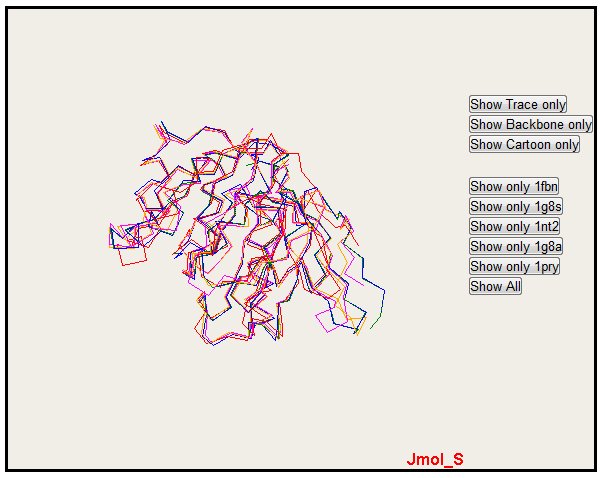
Trace rendering.
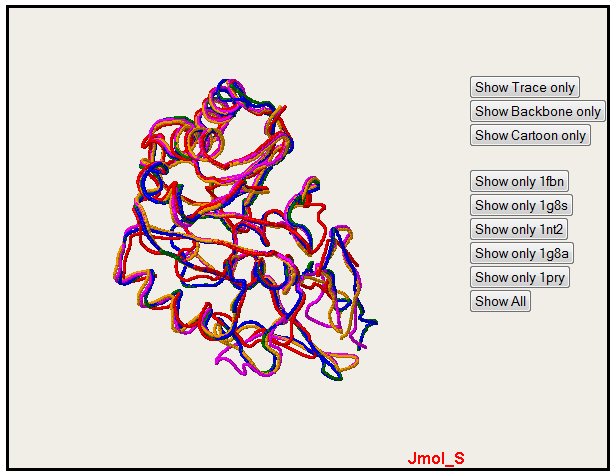
Only one structure can also be selected with the button "Show only" (please notice that colors are the same for alignment, PyMol and Jmol)
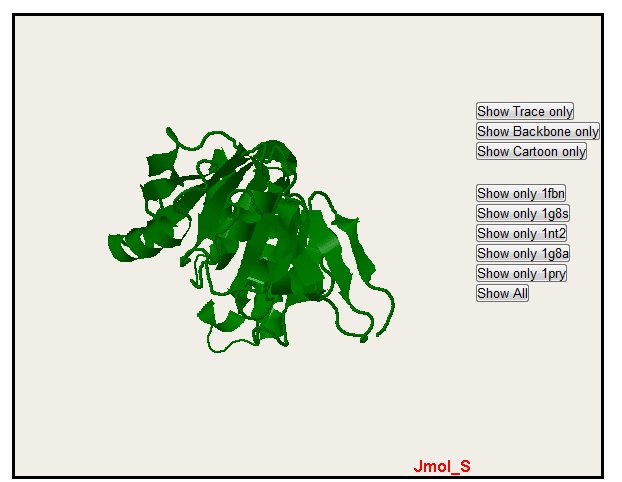
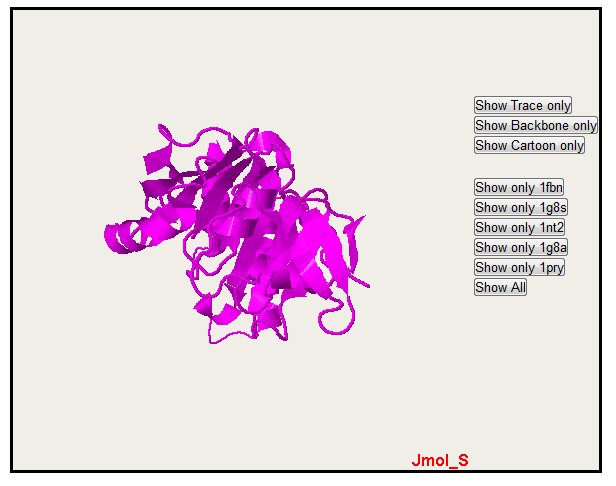
In the all sequence display, you can also hide sequence with the "Hide" button. Note that you only hide one sequence. The "Show All" button permit to come back to the default display with all the sequence.