A. The sequence
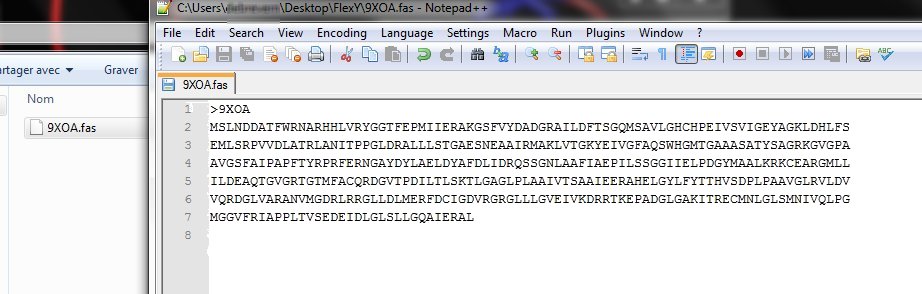
As noticed, the purpose of this webserver is to predict protein flexibility using the sole information of the protein sequence. The only need is so a file with a protein sequence in FASTA format (ex:9XOA.fas).
You can also copy and paste a fasta file in the text area.
FASTA file is a text file with the first line beginning with ‘>’ while the other lines are the amino acid sequence. Please note that no other format is allowed.
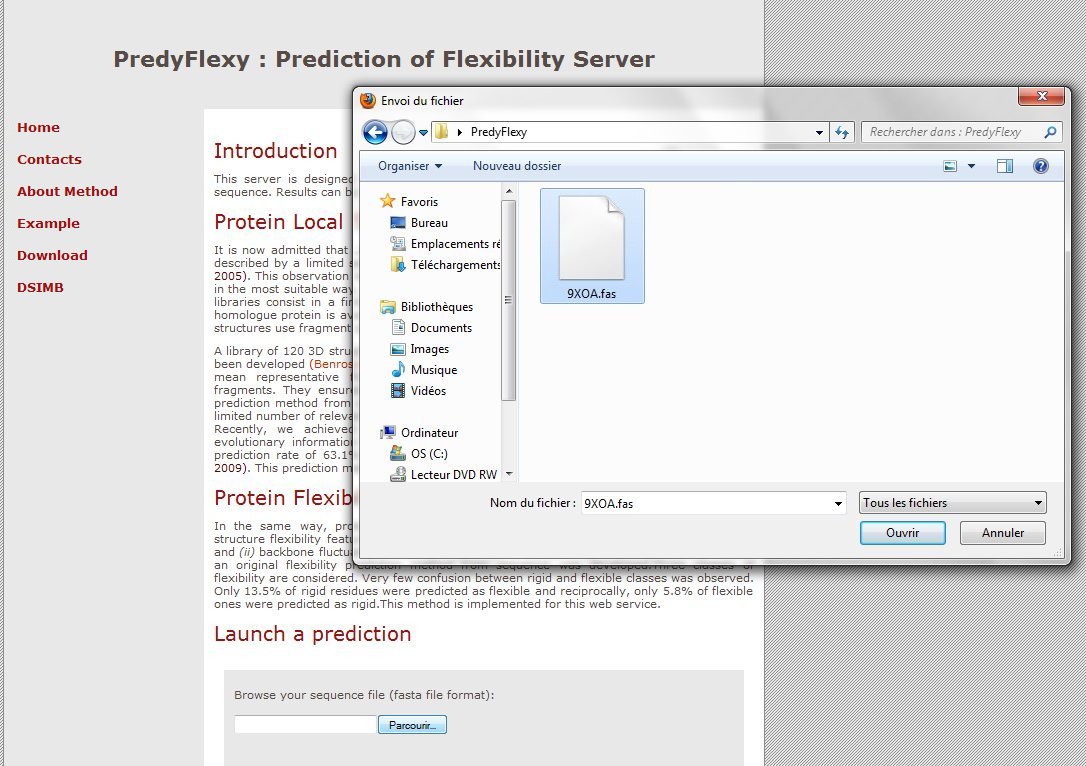
B. Upload the file
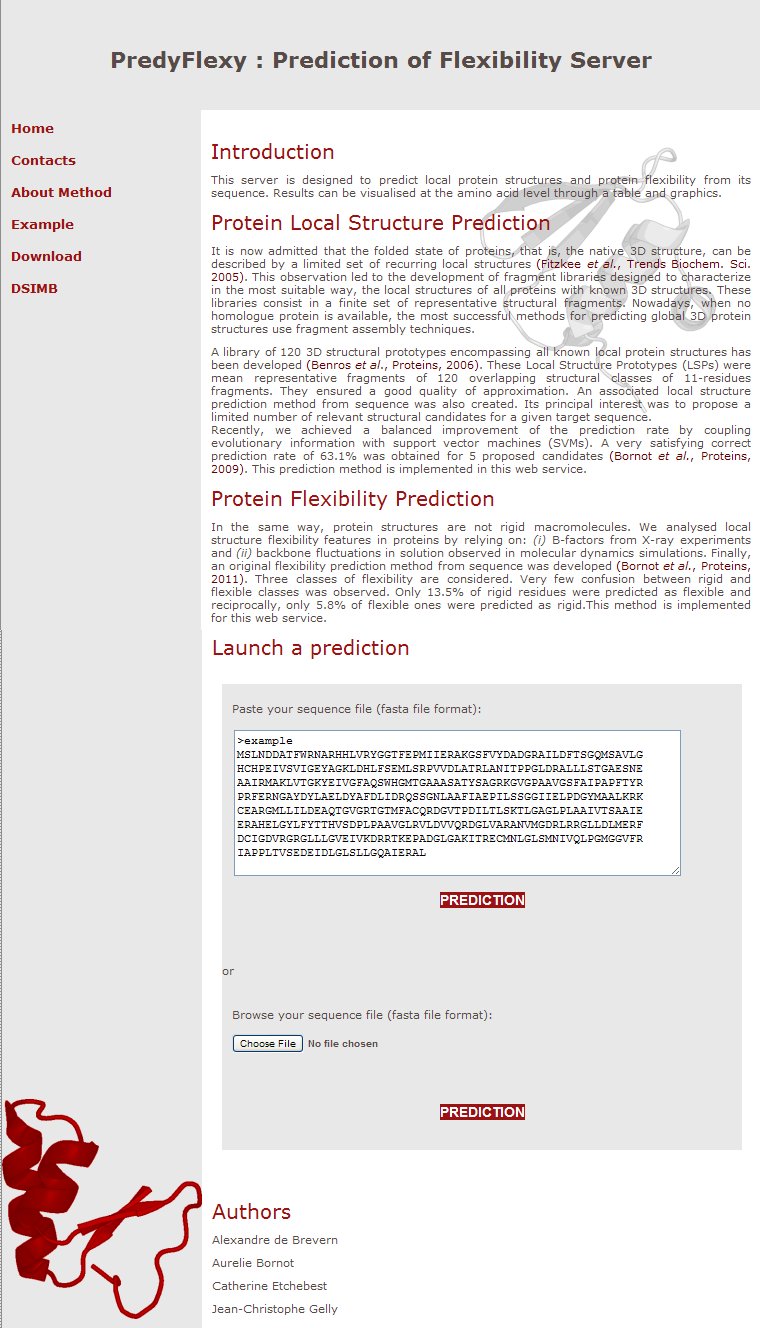
The interface is very simple. You only need to upload a fasta file or copy and paste sequence in fasta format.
And press the PREDICTION button:
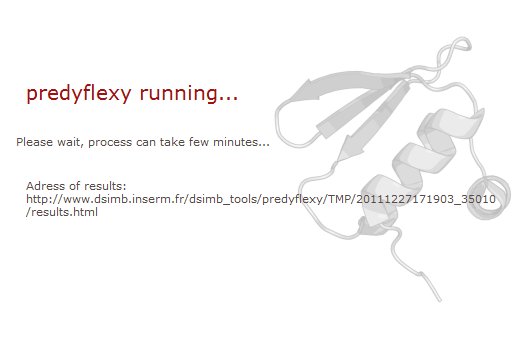
If everything is correctly done, you will see a waiting message with a link to the address of results. Results will be keep on the webserver during one month.
In case of it is not a FASTA file, you will see the following message.

C. The results
One page result summarize all the different information:
1. All results in flat file
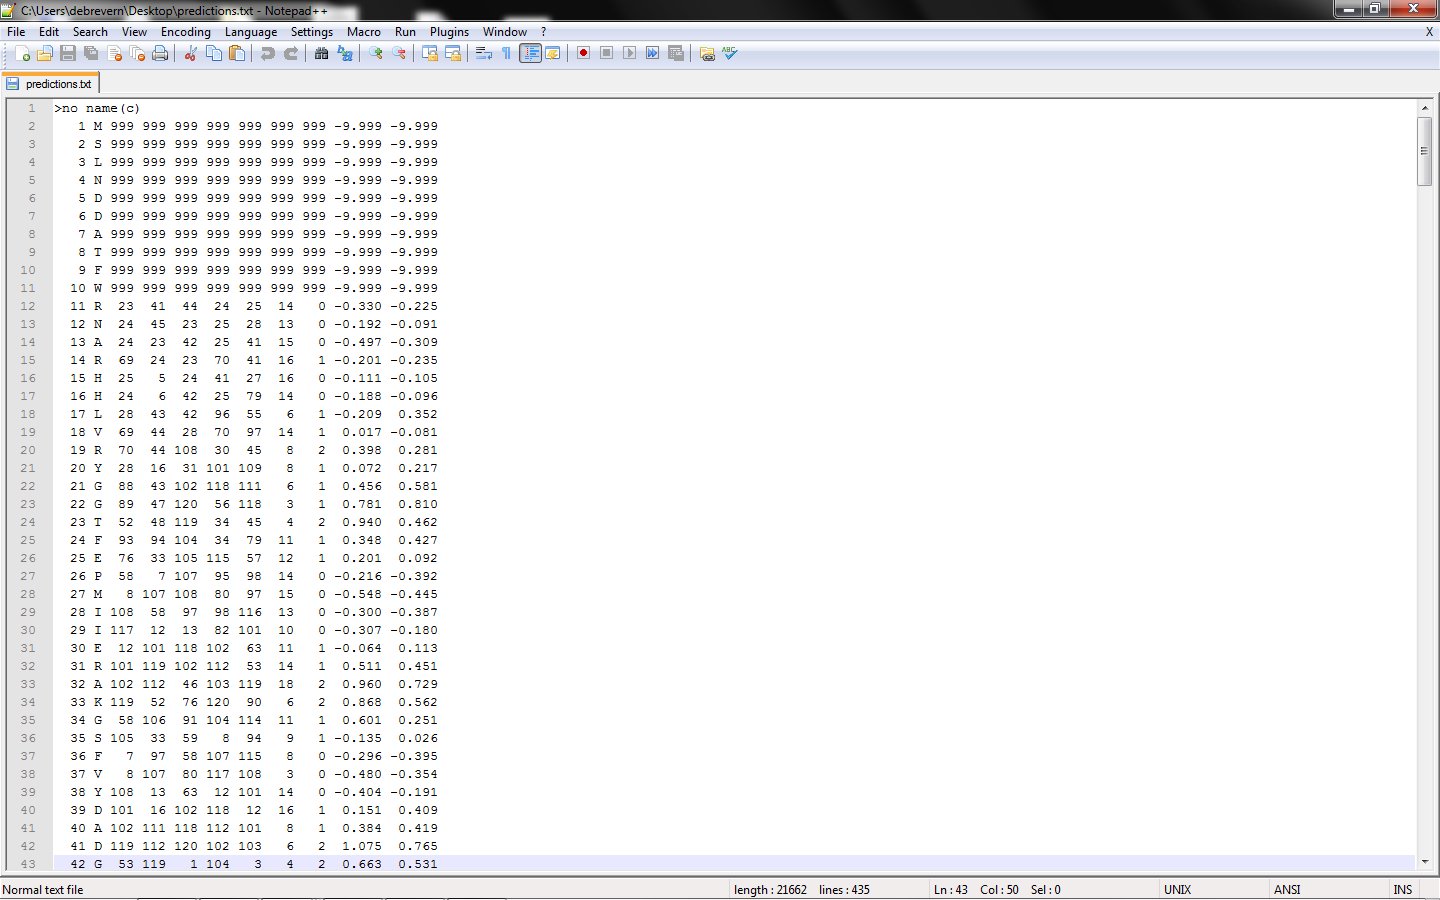
The result file is very formatted and o quite simple to read and use (example file).
First column – residue number
2nd column – amino acid type
3rd to 7th columns – the prototypes predicted (useful information for deep research)
8th column – prediction confidence index
9th – prediction class (0): rigid, (1): intermediateand (2): flexible
10th column – predicted normalized B-factor value
11th column – predicted normalized RMSF value
Please note due to the length of the prototypes used for the Structural alphabet (11 residues), first and last residues are not predicted.
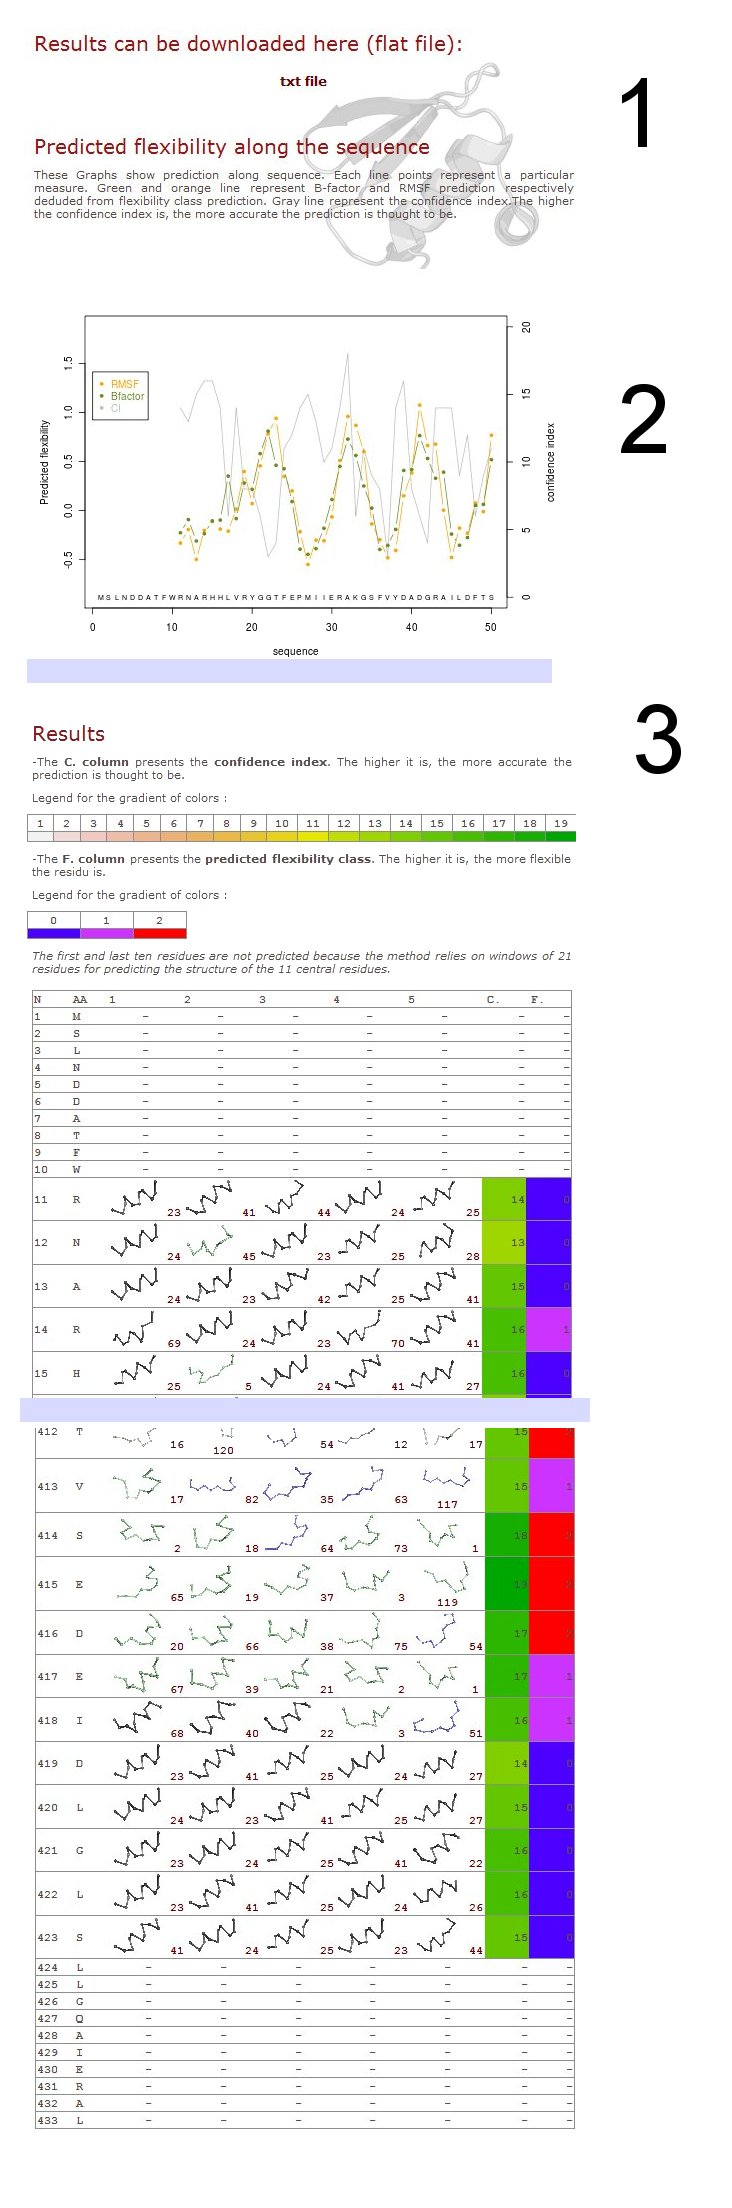
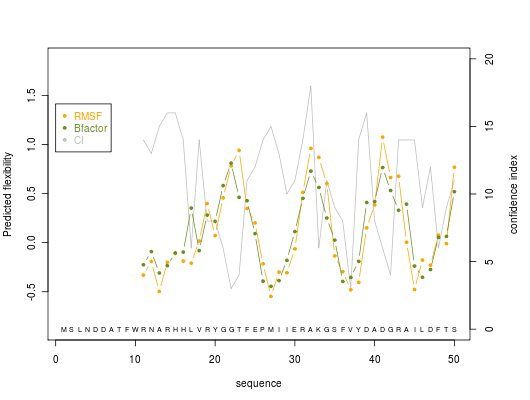
2. Graphics
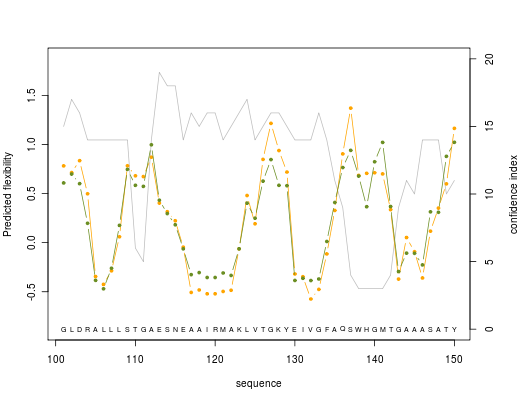
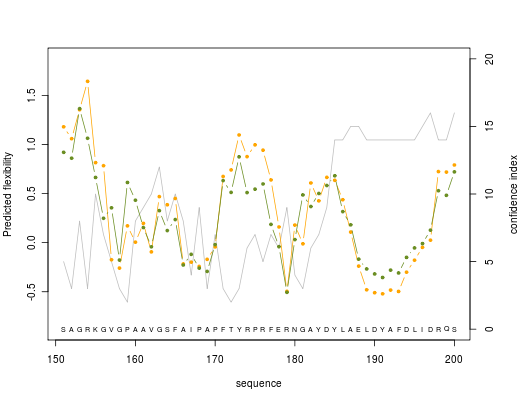
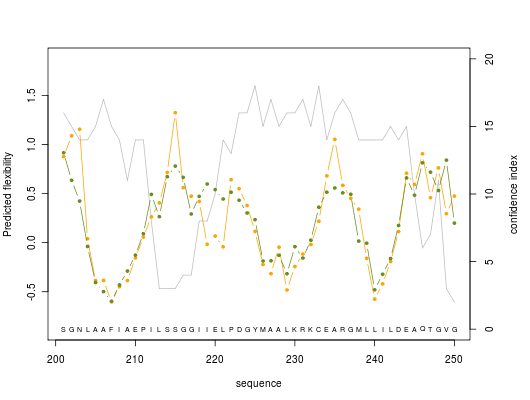
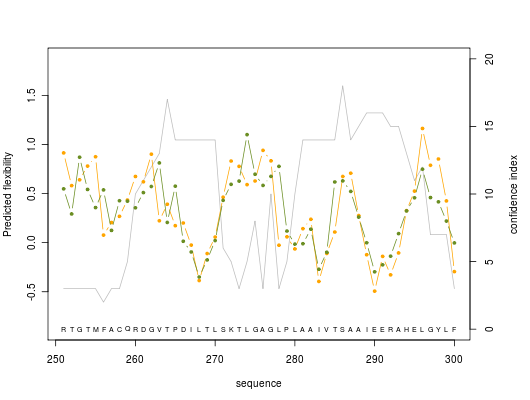
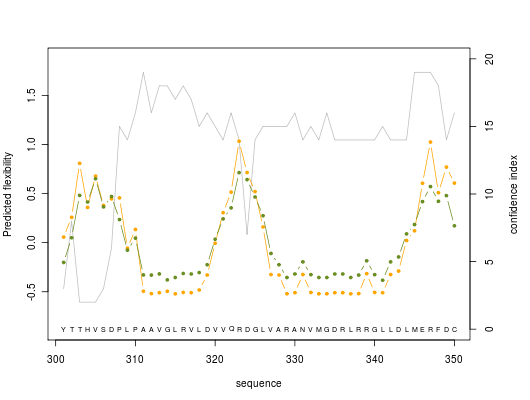
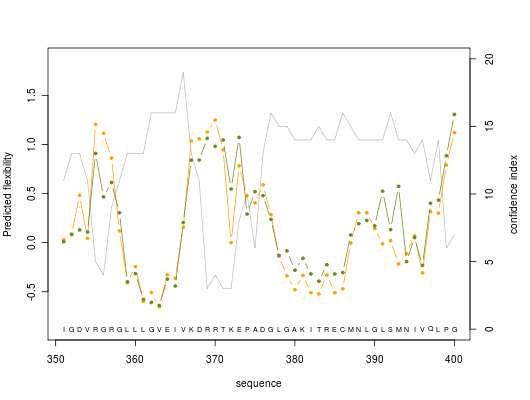
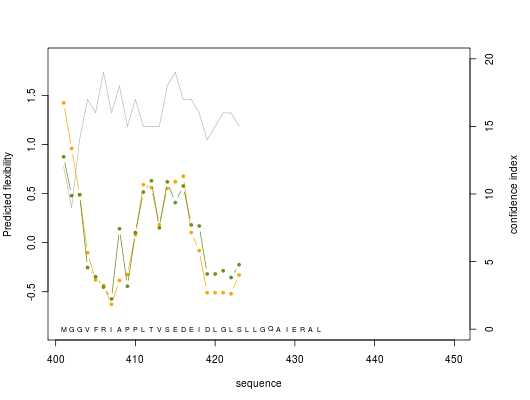
Predicted normalized B-factor value (orange line color), predicted normalized RMSF value (green line color) and confidence index value (grey line color) are plotted on graphs of 50 residue length
For others graphics : graphic 2, graphic 3, graphic 4, graphic 5, graphic 6, graphic 7, graphic 8.
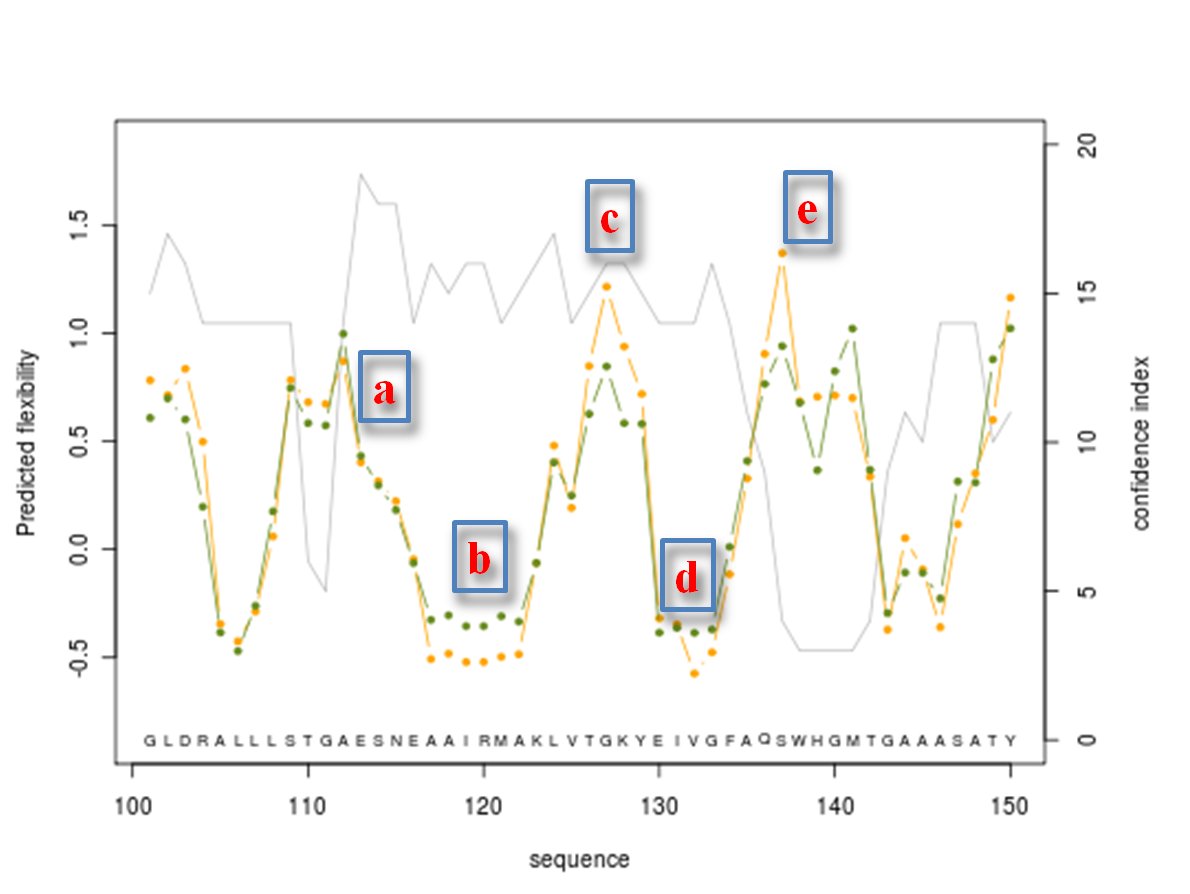
Here is shown the graph representing the protein residue ranging from 100 to 150. Regions (a) to (d) are protein residue predicted with a high accuracy (confidence index of 15 or better, it represents flexible (a) to rigid (b) with a nice intermediateto flexible zone (c) then come back to rigid zone (d). Following region (e) is predicted as flexible, but is not reliable with a low confidence index equals to 3.
3. Predicted prototype representation
In the previous section was highlighted the predicted normalized B-factor and predicted normalized RMSF. Here are shown the predicted flexibility classes encompassing both data taken from X-ray structures and molecular dynamics.
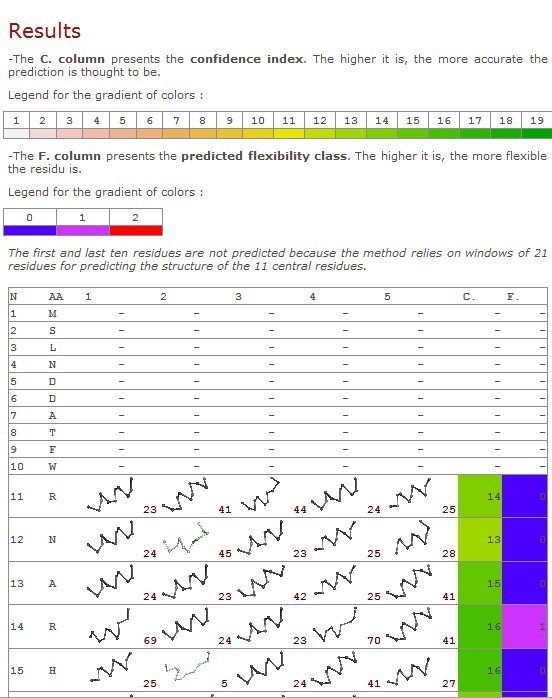
First column – residue number
2nd column – amino acid type
3rd to 7th columns – the prototypes predicted (useful information for deep research)
8th column – prediction confidence index
9th – prediction class (0): rigid, (1): intermediateand (2): flexible
Prediction confidence index is colored from white to green while the rigid class is colored in blue, the intermediate class in violet and the flexible in red.
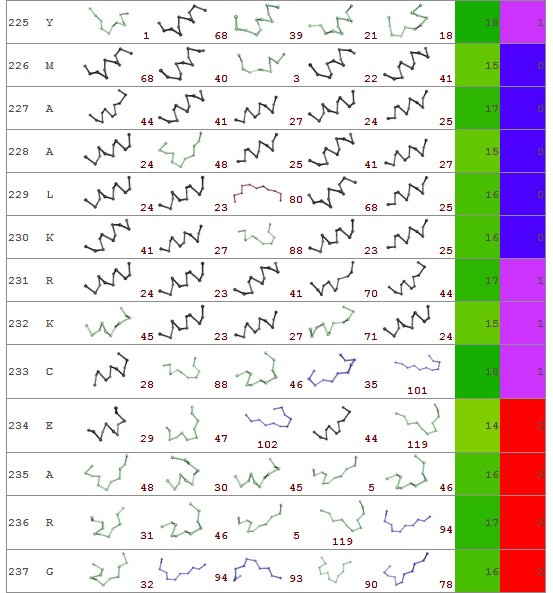
Here is shown an example encompassing residues from 225 to 237. Interestingly the prediction index is very good for this entire region. A succession of rigid (226 – 230) – intermediate (231 - 233) and flexible (234 – 237) residues is found. For a further analysis, the rigid region is predicted [Bornot 2009] mainly as helical structure while intermediate and flexible region is composed of loop and beta-turn residues.