Example of SWORD2 prediction for 1JX4.
(see output here)
Let us consider the example amino acid sequence of leghemoglobin A extracted from PDB ID 1jx4 chain A (RCSB PDB).
Job submission.
User can either provide a PDB ID (SWORD will try to fetch the corresponding PDB file from the PDB FTP server), upload a structure using Browse button (only the official [.pdb, .ent, .cif] file extensions are accepted), an AlphaFold Protein Structure Database v4 UniprotID, or an ESM Metagenomic Atlas MGnifyID. You are also able to specify a chain (careful, "A" is not the same chain as "a") for either the PDB code or the uploaded PDB file. In case the PDB file contains multiple models (NMR) SWORD2 keeps only the model #1. If the chain field is left empty, chain "A" is set by default. If the PDB file contains no chain, SWORD assigns chain "A" by default because a chain is required for the process to complete.
It is recommended to fill your e-mail address to receive a notification once the job has finished.
Once you filled the Captcha (as you are certainly not a robot!) and clicked on the Submit button your structure is sent to the server for calculations. You are redirected to the waiting page where you can monitor your job progress.
After the computation is finished, the results will automatically appear on the same page URL as it is regularily auto-refreshed. If you provided an email adress, the results will also be sent to you.
You can therefore bookmark and quit the page while waiting.
You can kill your job at any moment by clicking on Kill job!.
Interpretation of the results.
Here is an example of a protein domain assignment returned by SWORD2 for PDB ID 1jx4 chain A.
1 - Ambiguity index of the structure (A-index).
A-index is a measure of variability of the possible protein decompositions in multiple domains. It represents a balance between the number of partitions identified and the quality of their domains. A protein has an A-index of A if A of its Nd domain partitions have a quality of at least A, and the others (Nd - A) domains each have a quality lower than x. Meaning that a low A-index is neither good nor bad as a protein with few high-quality domains and a protein with many low-quality domains will both have a low A-index (see About page for the details). For the considered example the A-index equals 3 since we observe 3 different partitions with quality (several quality criteria described in About page) greater or equal to three (the optimal one and alternative partitions n°6 and n°7):
2 - Summary.
The summary allows the user to have a quick, general and interactive overview of the SWORD 2 results. The interface shows the possible domain decompositions of the queried protein. It displays along the sequence the domains determined by SWORD2 ("Domains”), the PUs ("Proteins Units”) that compose them, the secondary structures (DSSP) and the inter-PUs junctions ("Junctions”; "Counts”, "Frequency” and "Weights”). The junctions correspond to the extremities of the different PUs used by SWORD to build the domains. "Counts” is the number of times a junction is found among all SWORD2 alternative partitions. "Frequency" represents the junction count, standardised by the total number of domain delineations produced. And "Weights” represent the frequency weighted by the delineation quality and standardised by the total number of domain delineations produced. Each element can be easily visualised in the 3D viewer by simply clicking on them, which will also update the corresponding distance probability map.
Two different sets of colors are used consistently in the results page:
- Domains: a set of dark tone colors
- Protein Units (PUs): a set of lighter tone colors
Thus, a domain colored in orange will always be referenced with the same color elsewhere.
Same rule for Protein Units, their colors are used consistently in the whole results page.
3 - Optimal domain assignment.
SWORD provides an optimal domain assignment according to several quality criteria described in About page. The bars indicate the quality of domain partition (here equal to 3 out of 5). To colour the protein in domains, click on the Display button. For each identified domain, the ranges of the residue numbers of the PUs composing them together with their respective energy and Z-scores are provided. Also, like in the Summary, clicking on an individual domain (DOMAIN) will focus it in the 3D viewer and update the distance probability maps.
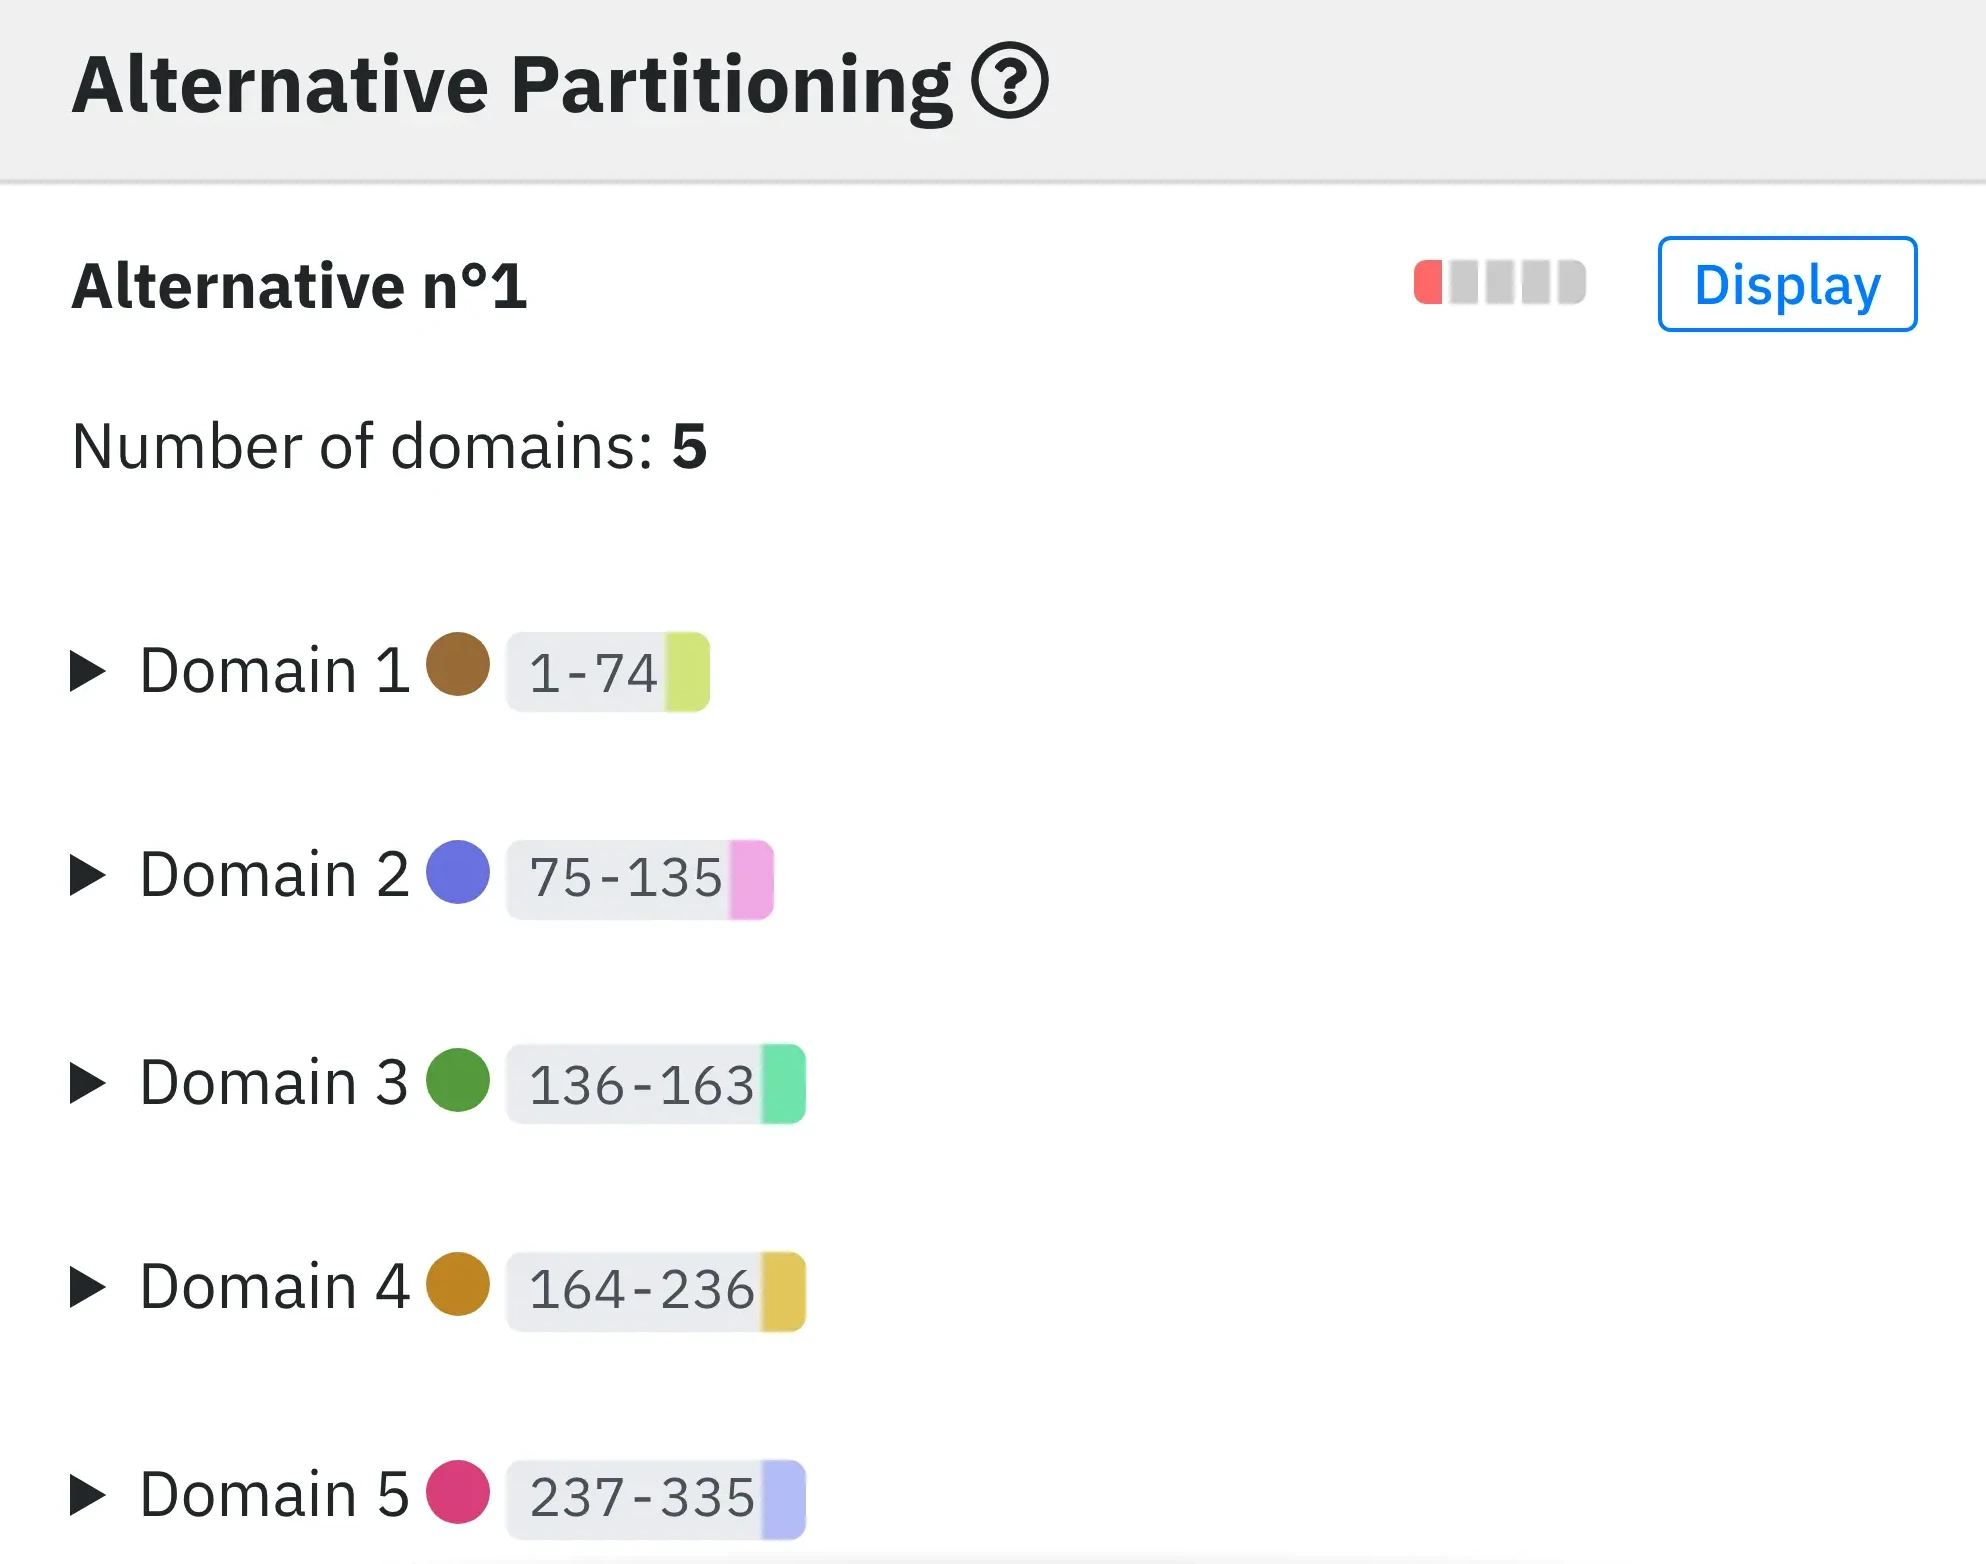
4 - Alternative domain assignments.
On the same principle as Optimal partitioning, we provide all the alternative domain partitions (7 of them in this example). To colour all the domains of the 3D protein structure according to an alternative partition, click on its Display button.
5 - Peeling levels.
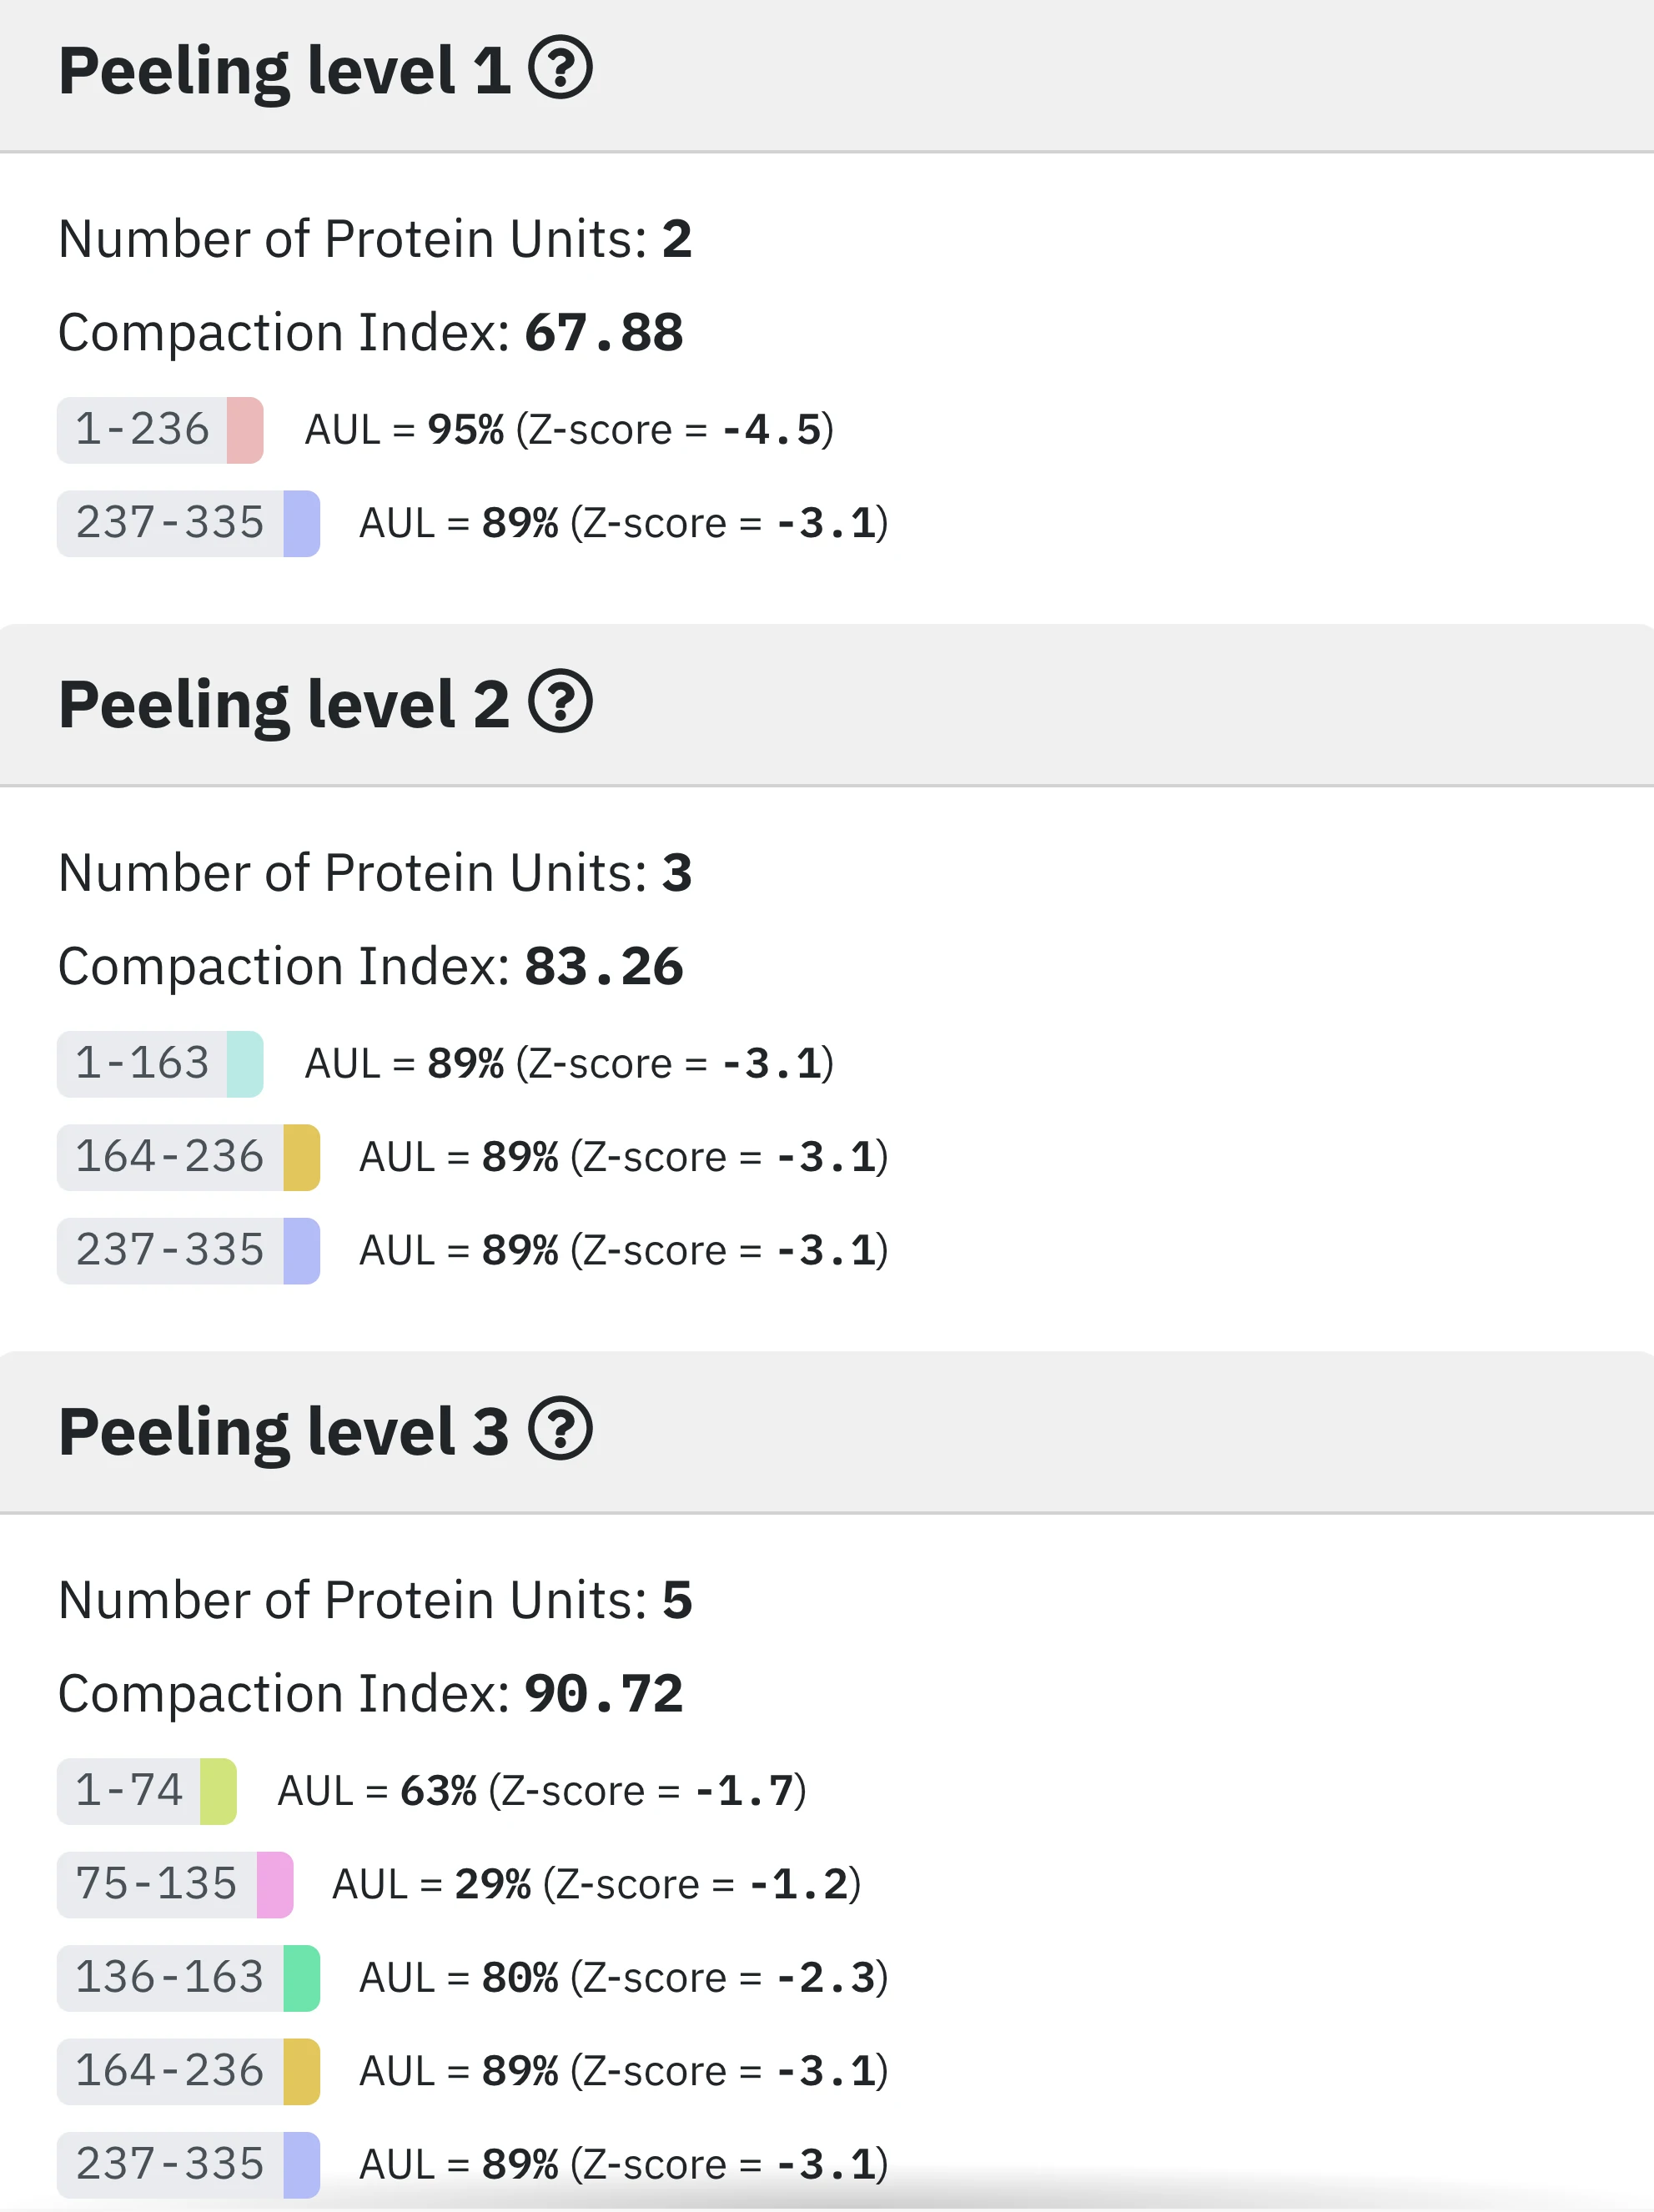
As explained in the About page, SWORD starts by identifying PU using the Peeling algorithme, before gradually merging them according to specific criteria.
The "Protein Units" tab shows the exhaustive set of Protein Units determined by the Peeling algorithm at different peeling levels, from 1 to n. A low Peeling levels reveals few and rather long Protein Units, whereas higher Peeling levels present more and shorter PUs. A colored badge start-end represents a PU that was used by SWORD for the hierarchical construction of the domains of the different alternative partitionings, while a black one start-end means that it was not used at all.
For each Peeling level, we calculate an entropy-derived measure that allows assessing their compactness: the Compaction Index (CI) (4). This index focuses on the non-local contacts in the PUs.
We assess each Protein Unit using the scoring function IG-score (5) which measures the structural consistency and evaluates the potential of units to fold.
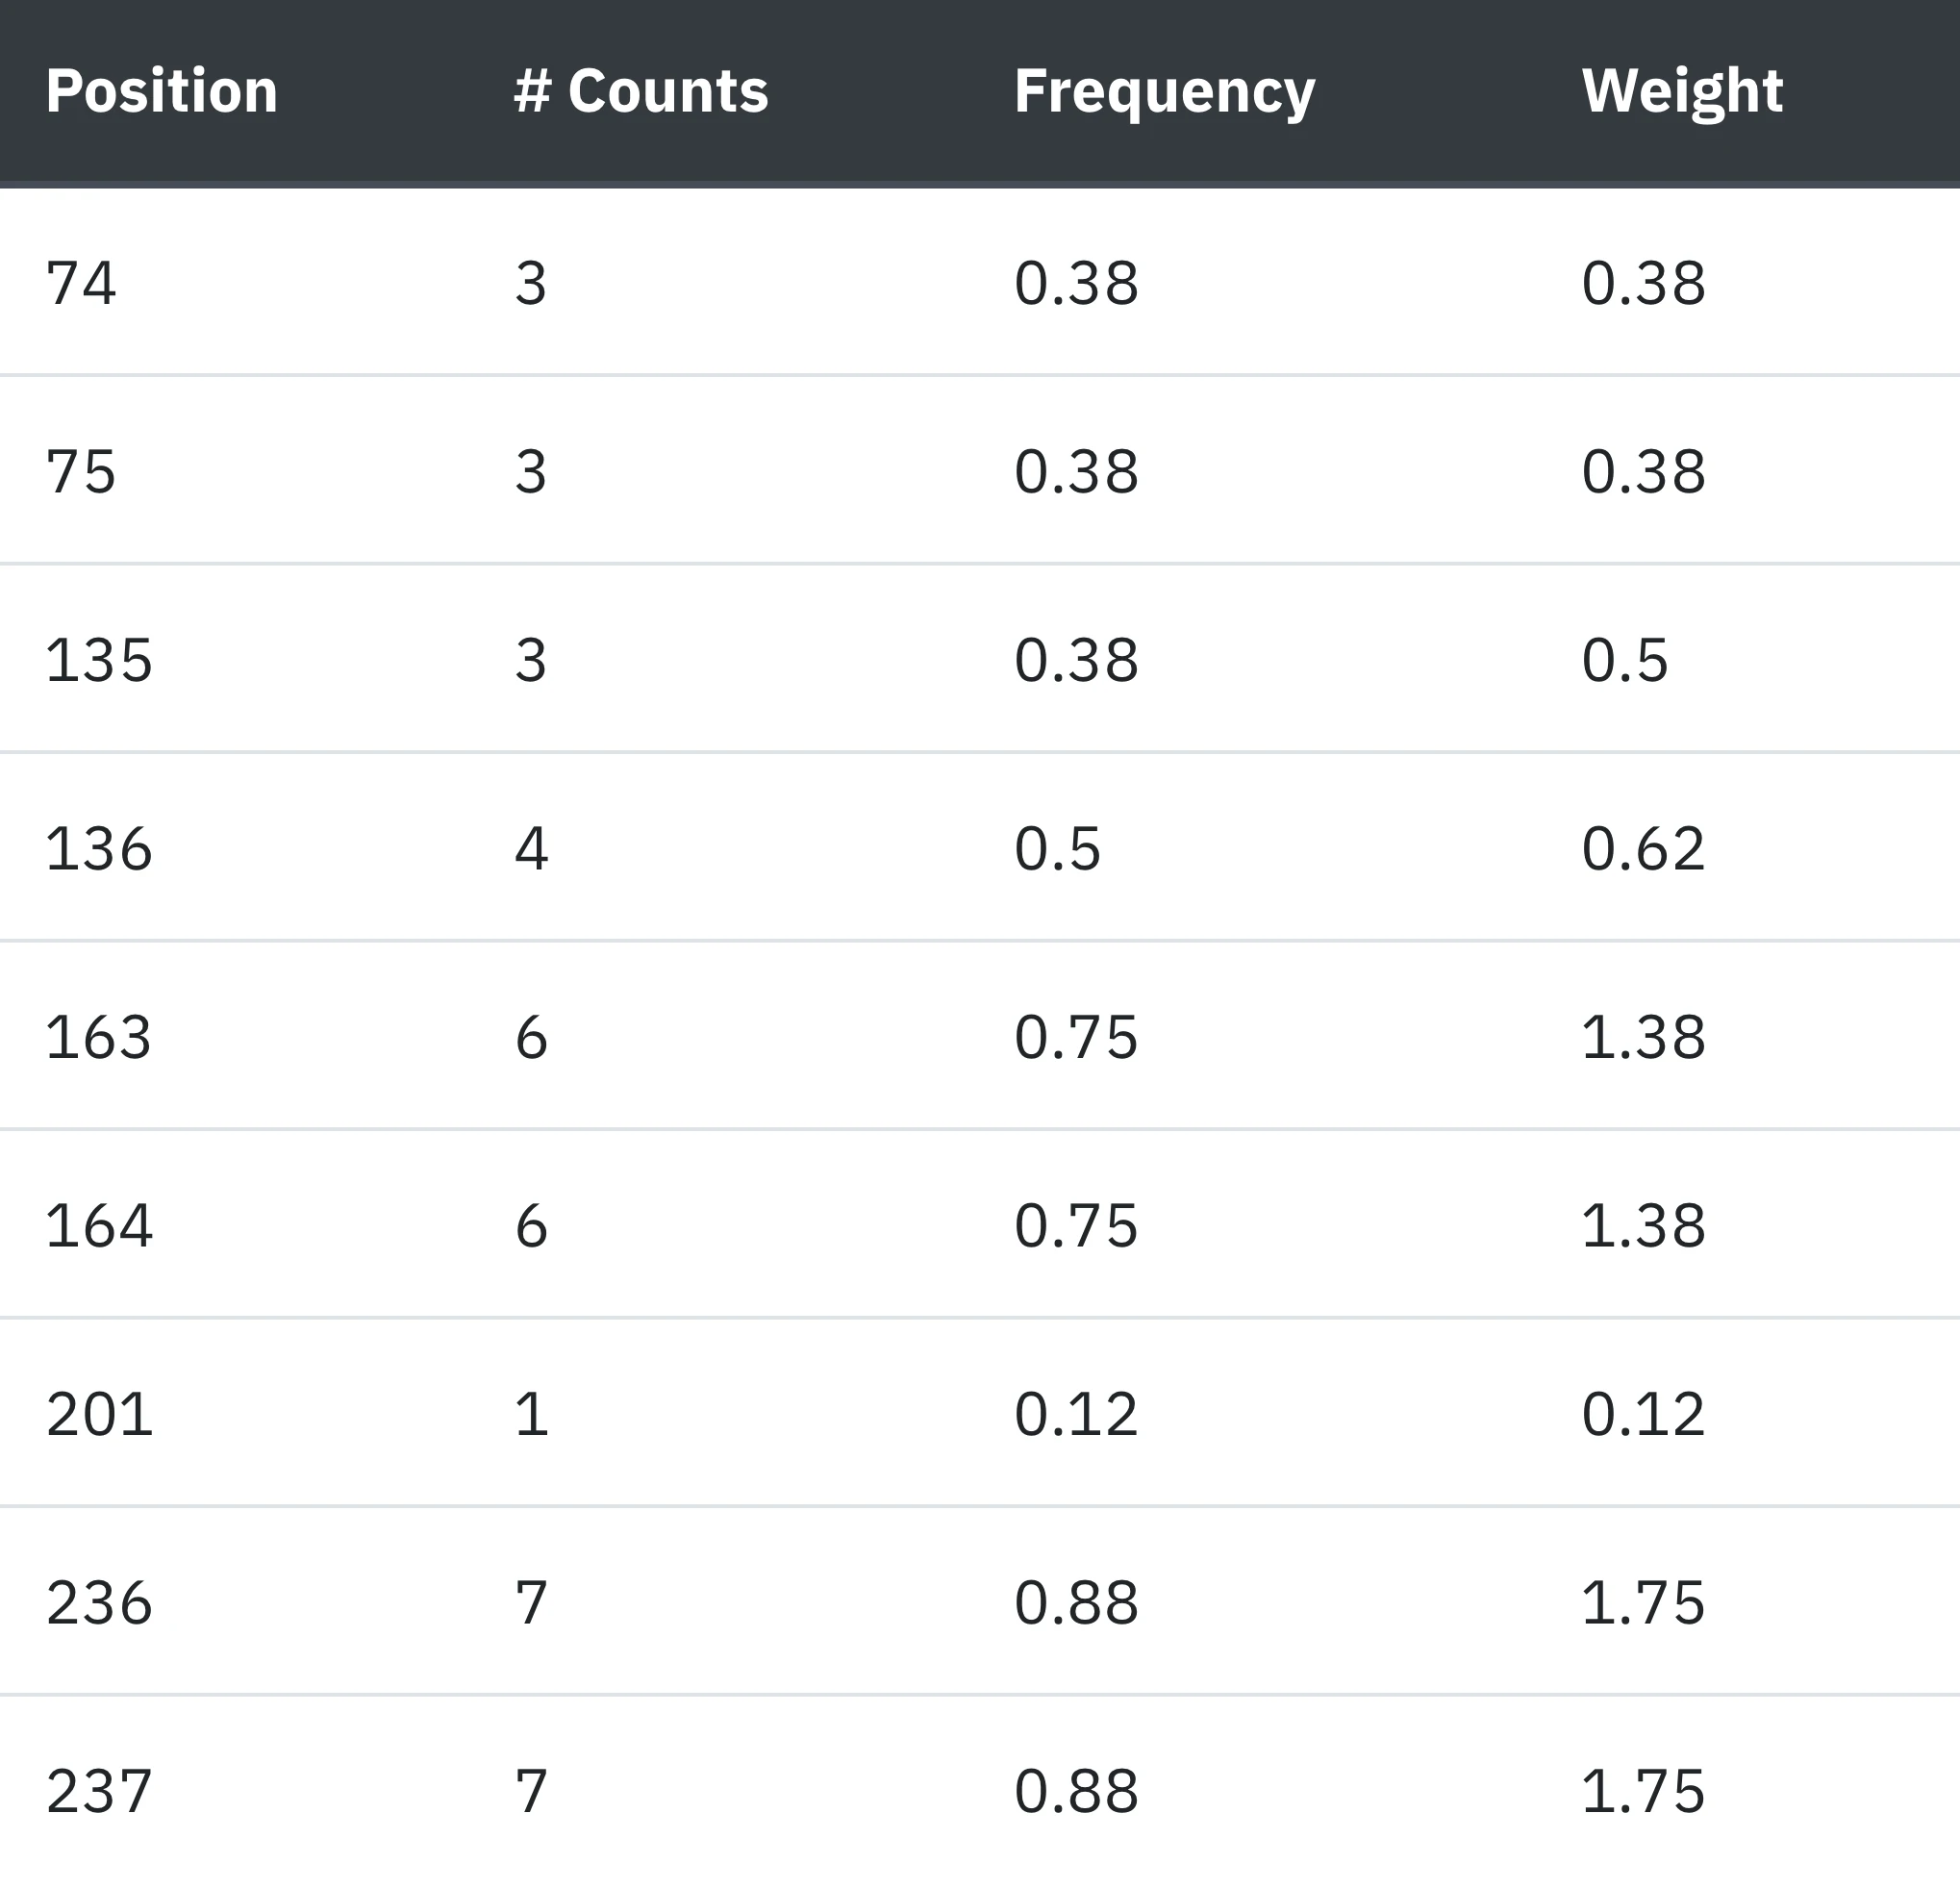
6 - Junctions.
Junctions correspond to the extremities of the different Protein Units used by SWORD to build the domains.
The "Junctions" tab provides detailed informations on their respective positions in the sequence, the number of times they are found among all SWORD partitionnings, their frequencies and weighted frequencies.
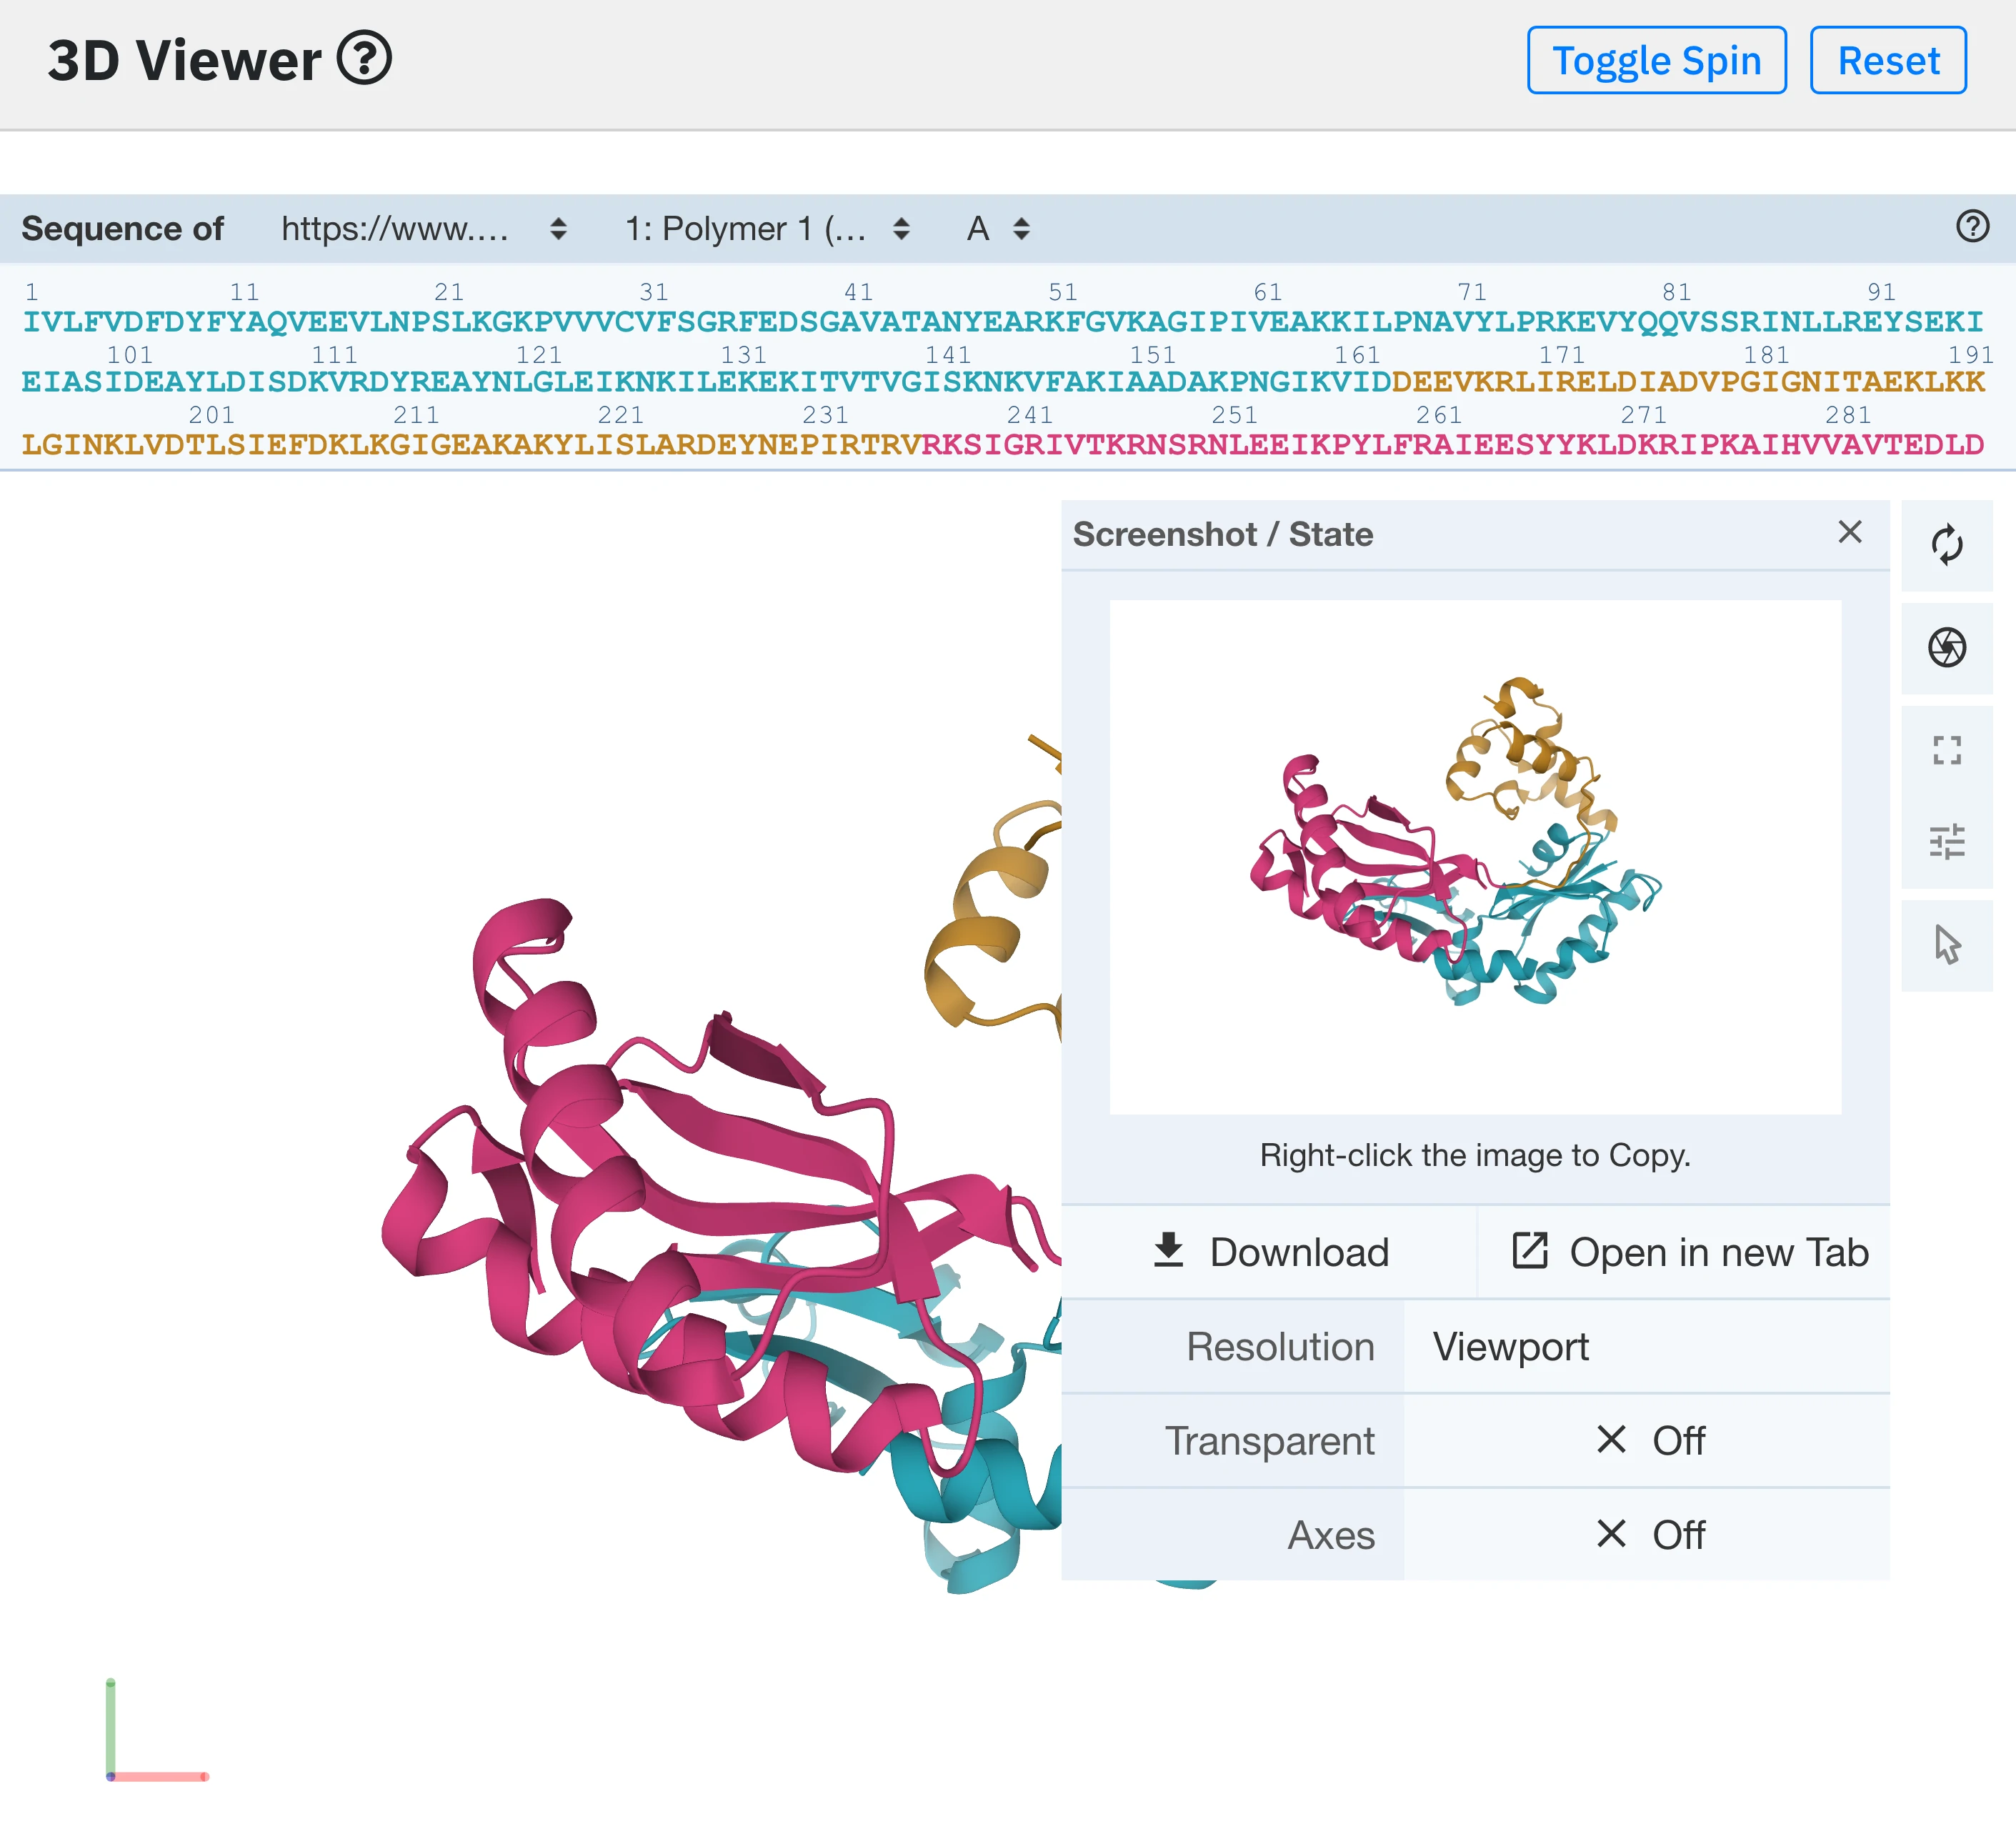
7 - Interactive visualisation.
The user can freely rotate, zoom and put the protein structure in full screen, as well as selecting residues by clicking on them directly on the structure or via the sequence viewer. In case the protein sequence is too long to fit in the original viewer size, the sequence viewer can be vertically resized by dragging down the bottom border.
When a user hovers a protein residue, it is highlighted in pink. When clicked, the 3D viewer will zoom on it and display the surrounding residues in all atoms instead of cartoon representation. To get back to the initial view, press the Reset button.
In the image on the right, the protein sequence starts with a residue number of 2 instead of 1. That is because in the original PDB file, the first residue has a resnum of 2. We keep the original numerotation so that it is easier for the user to refer to the original PDB file.
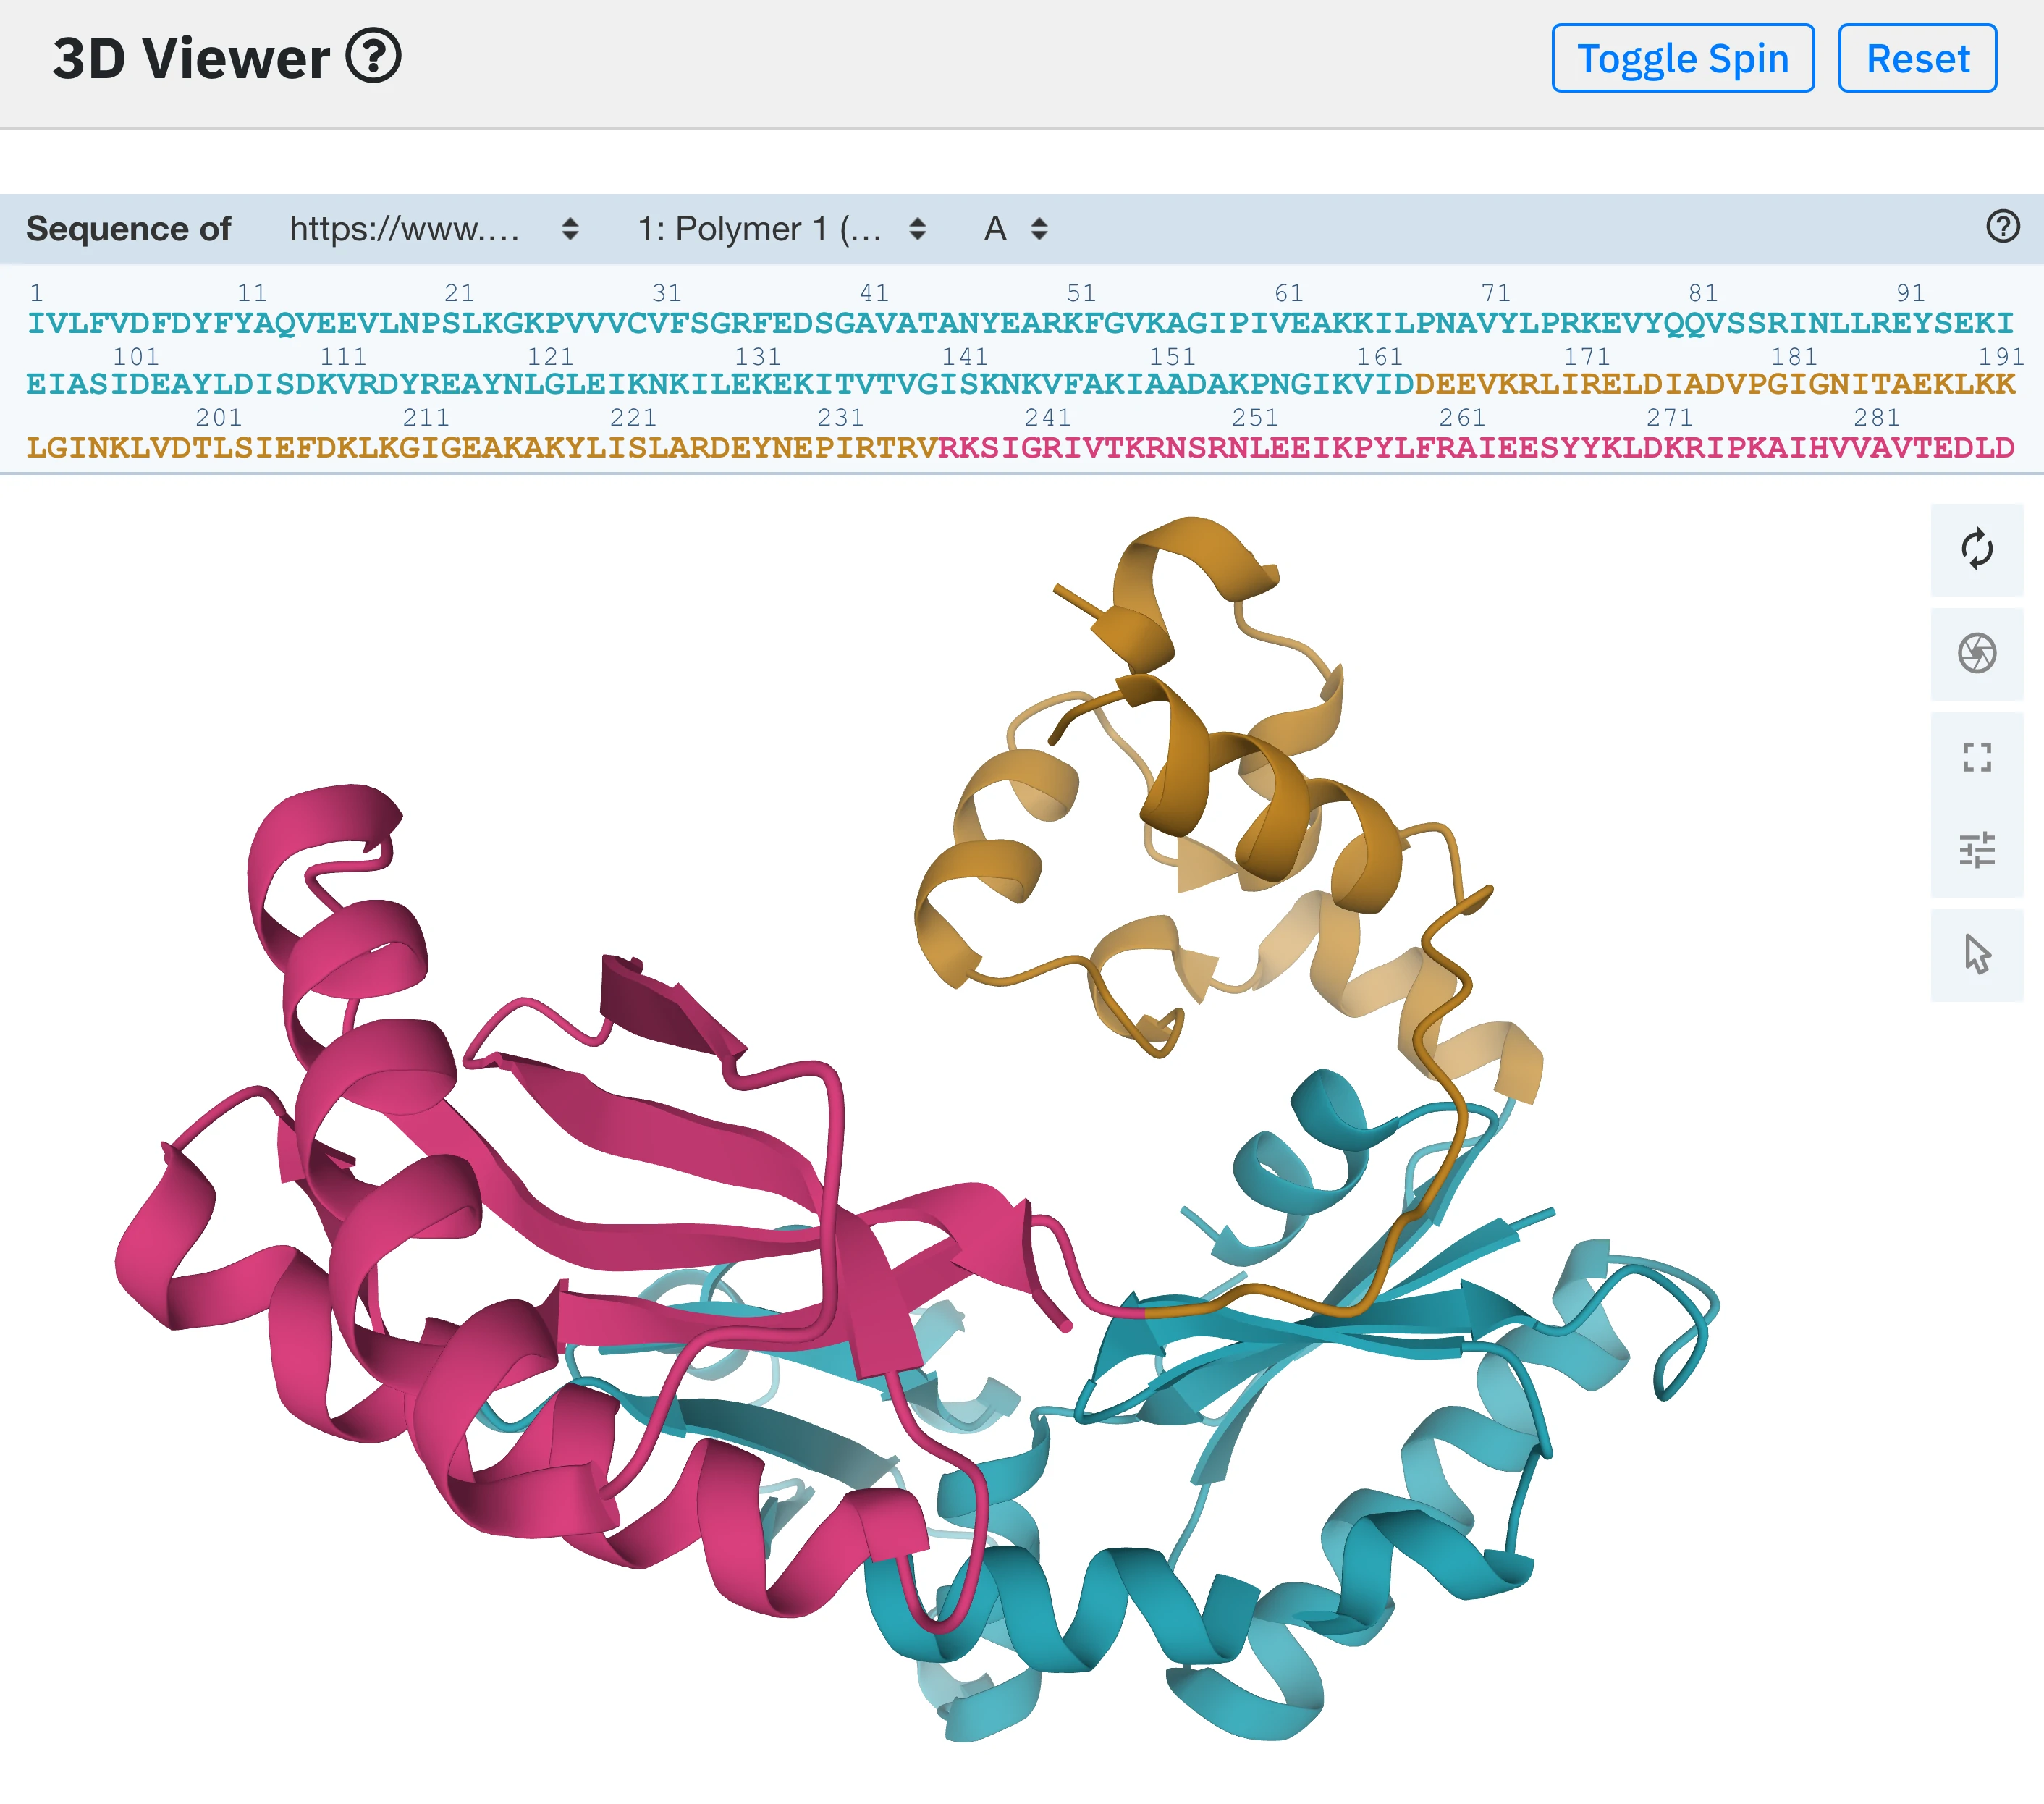
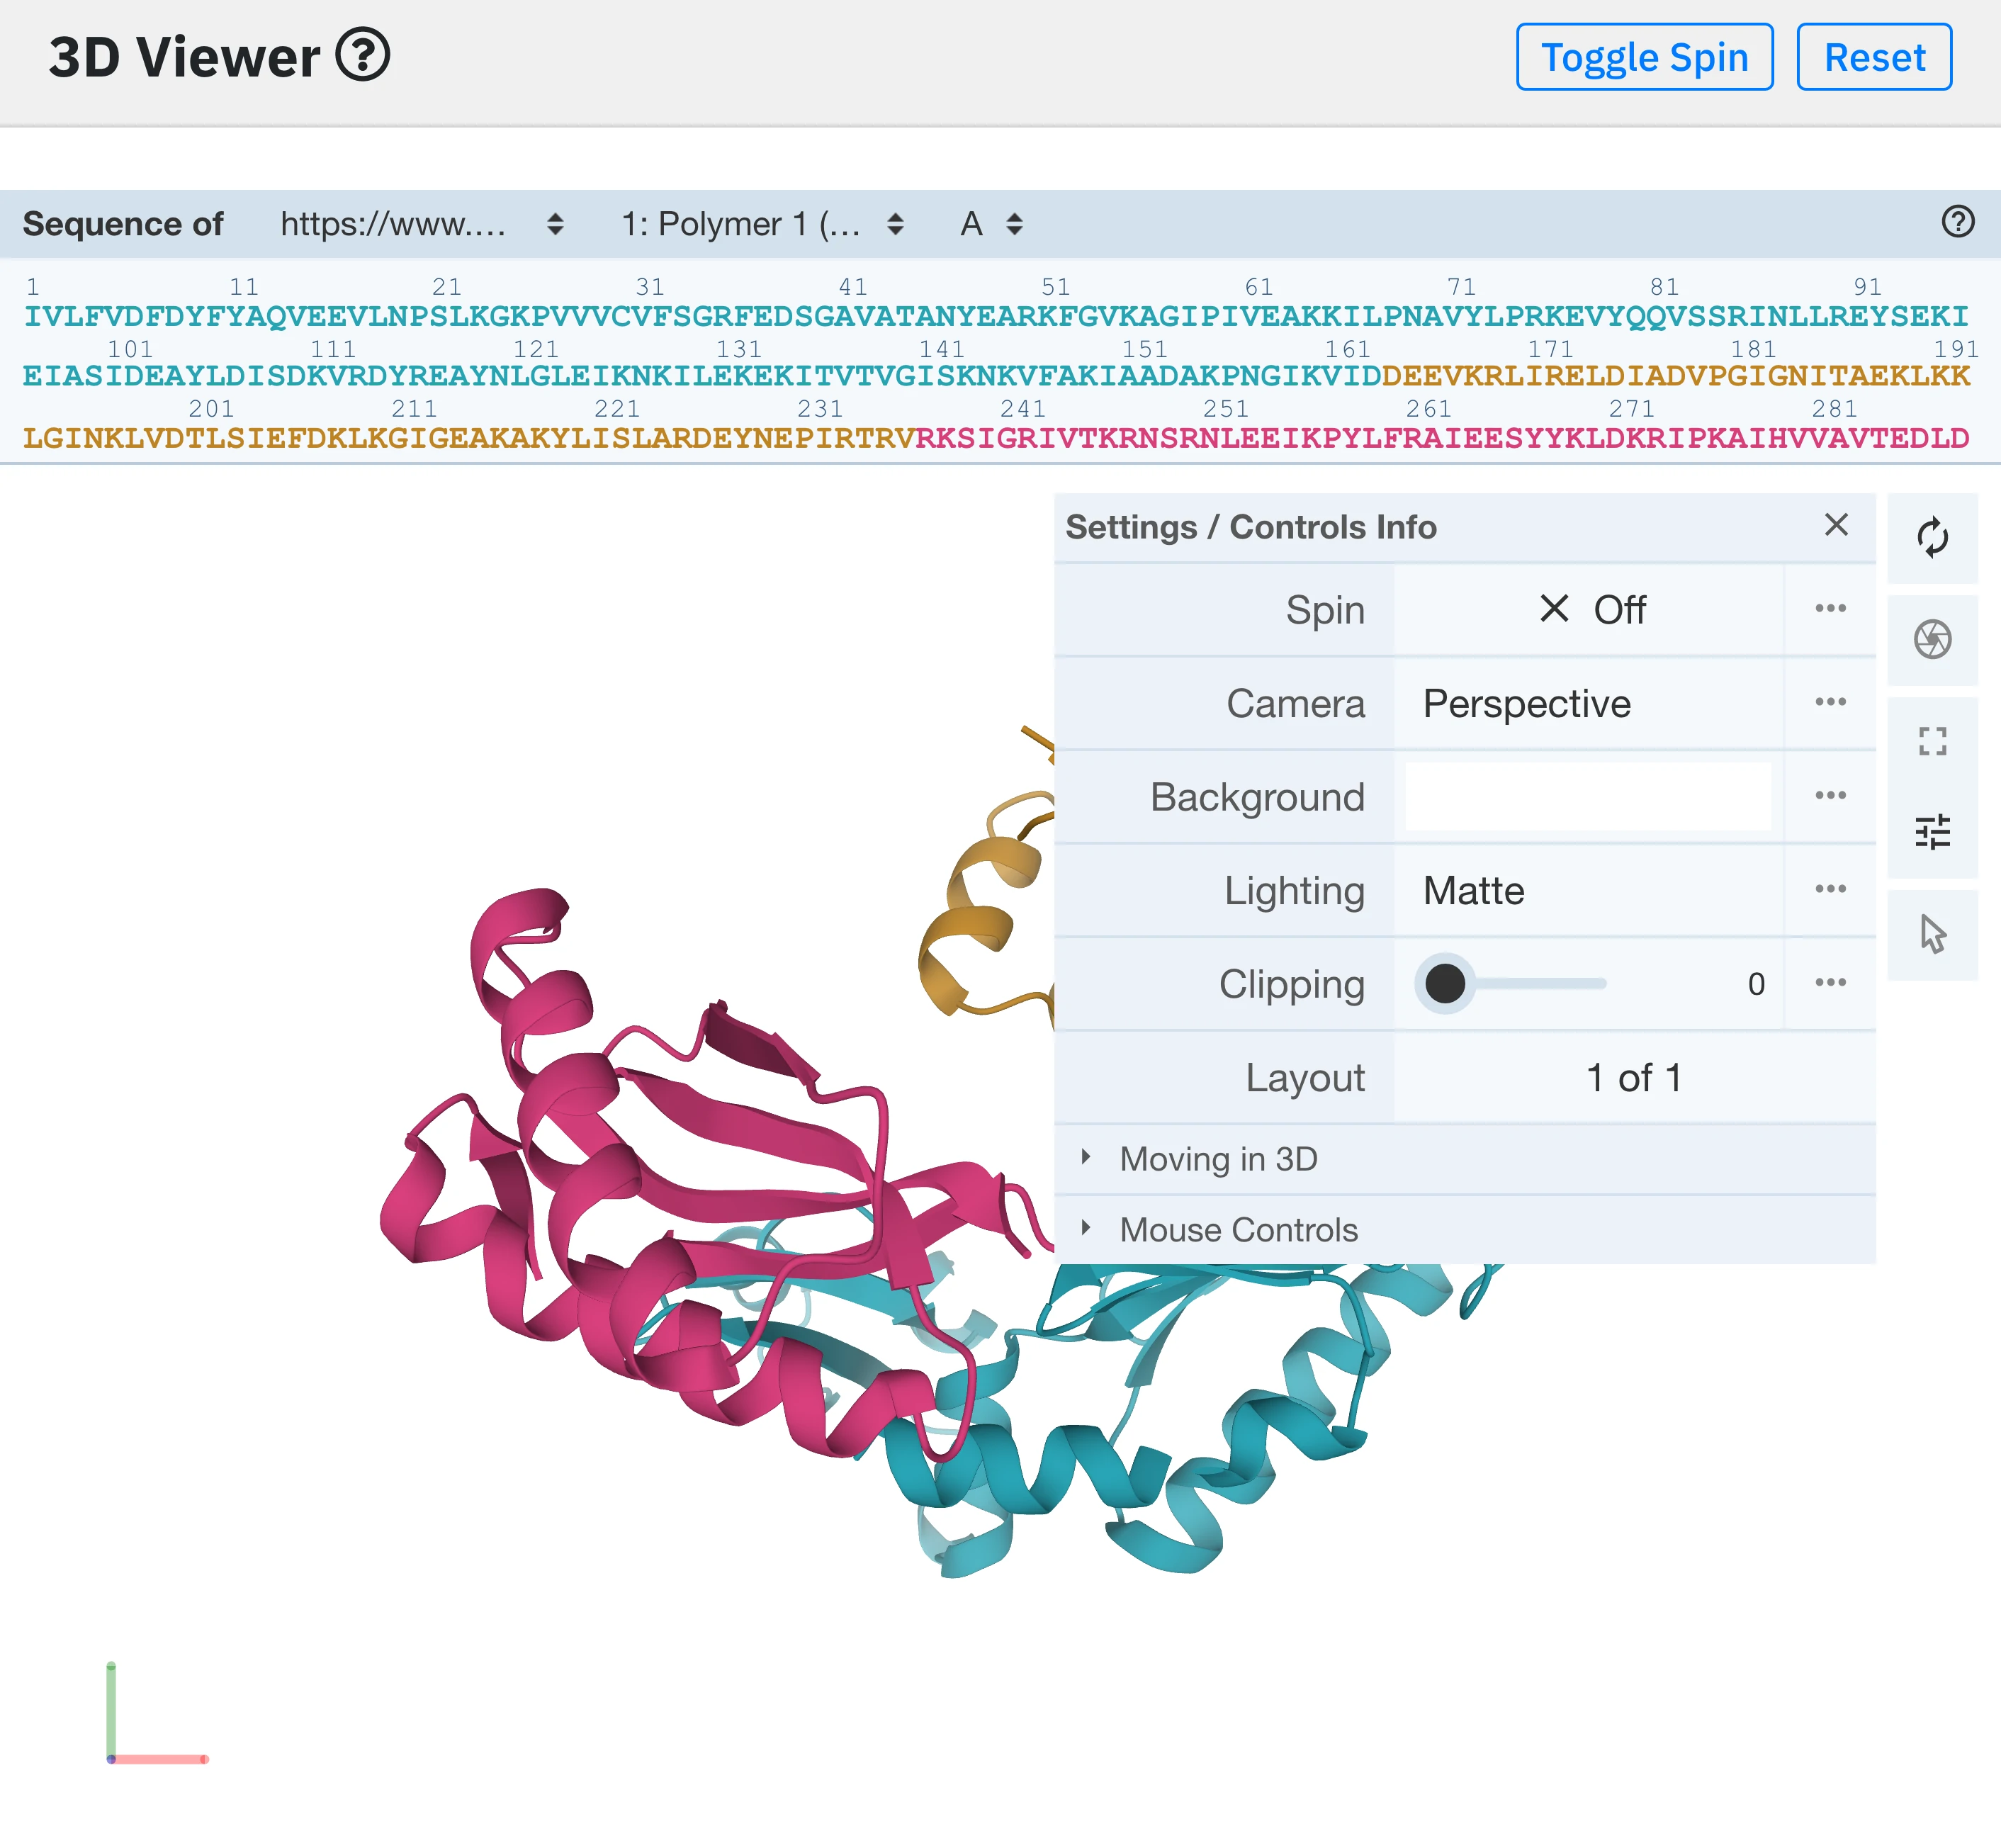
The 3D viewer plugin also gives the user the possibility to tweak viewing parameters (e.g camera perspective, background color, lighting, clipping depth) as well as to download a snapshot of the view at different resolutions.
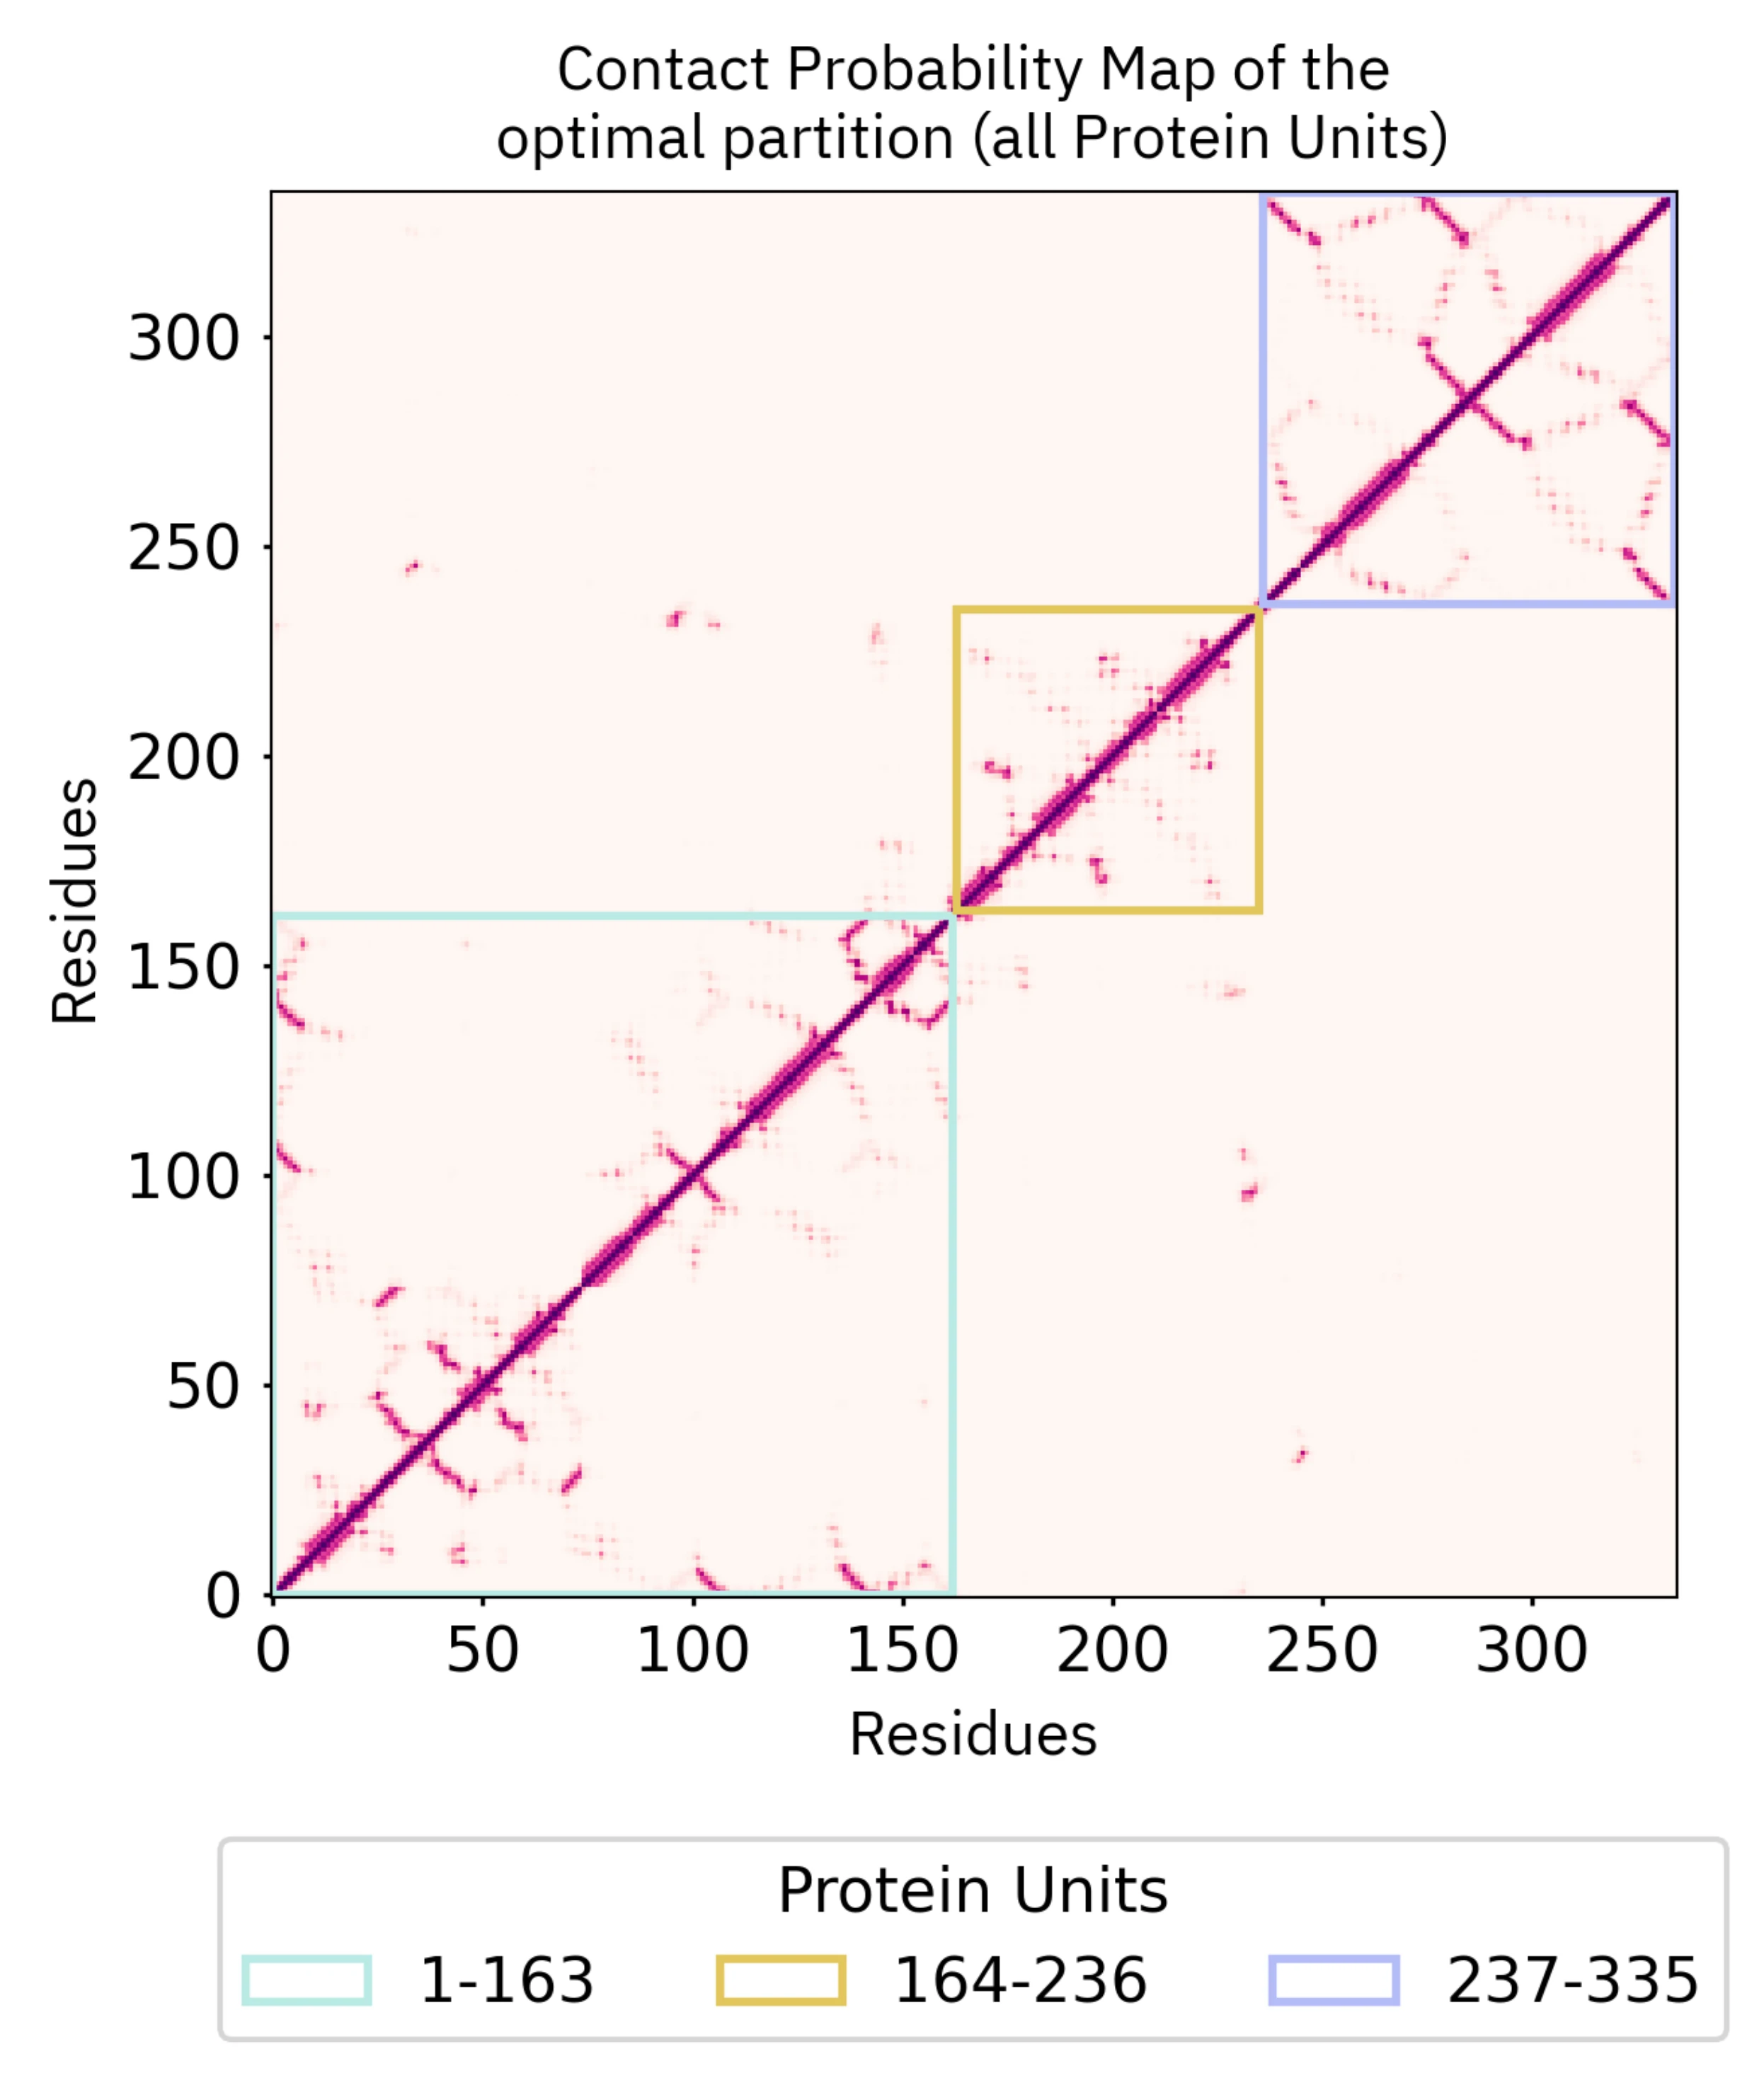
8 - Contact probability maps
We provide the distance probability maps for each domain of each partition under the "Contact probability maps" tab. Here we have selected Alternative 3 by clicking on the Display button and traced the corresponding PU limitations.
9 - Frequency of Protein Domains identified by SWORD
Finally, we report general statistics on the results of protein domain decomposition. We provide the domain count in all the identified alternative SWORD partitionings. Bars are ordered by descending frequency from left to right, which allows you to quickly identify the most consistent domains.
The Plotly interactive plot allows users to select particular columns (i.e SWORD domain), which generates a notification indicating that the corresponding domain was selected and therefore the 3D view and distance probability map were updated accordingly. Users can also download the plot as a .png file.