Introduction
Transmembrane proteins (TMPs) have essential roles in numerous physiological functions, e.g. ion regulation, signal transduction. They also are the targets of more than 60% of drugs. Nonetheless, due to their specific environment, their 3D structures are difficult to obtain. Only ~2% of crystal structures available in the Protein Data Bank[PDB] are TMPs, and only a limited number have a high resolution. These restrictions that limit our knowledge on the structures of TMPs, could be overcome with the help of computational modeling. Different approaches exist to build transmembrane protein structural models, e.g. Modeller, I-Tasser, ... However, it remains difficult to select the right structural model or to analyze it locally.
HPM score is a novel methodology able to select it properly. It has been benchmarked against the well used DOPE methodology [DOPE] and had been shown to be better in 60% of the case. The HPMscore webserver allows the user to compute the HPMscore for a library of input files to select the best structural model. It also gives local information on the sequence - structure relationship and 3D visualisation of the quality of the models.
Principle
HPM is a specific unsupervised learning method related to Self-Organizing Maps[Koho1, Koho2] without diffusion, their clusters being overlapping [HPM1, HPM2]. It can be used to reduce protein 3D-structural and physico-chemical information to 2D space [HPM2]. This methodology has already been used successfully for globular protein studies [HPM3, HPM4, HPM5]. For instance, it was used for prediction of protein flexibility (see PredyFlexy webserver [PFLEX1, PFLEX2]). Here, the HPM method has been used to learn the sequence-structure relationship found in all-α TMPs.
This method performs a complex training and the learning is refined by varying different parameters (see Figure 1). The main idea is to translate the 3D protein structures in terms of sequence AND structure. They are so cut in fragments of fixed length (in overlapping fragments), they will be clustered using the HPM approach. Its main particularity is that clusters overlaps sequentially, i.e., a cluster of length L overlaps with following cluster by the last L-1 positions, and so for all clusters (see Figure 1).
Learning
A non-redundant databank of all-α TMPs was built to perform the specific learning. It contains 65 protein chains of all-α TMPs (corresponding to 25,992 residues) with a resolution < 2.5 Å and sequence identity less than 40%. It was manually curated to remove important globular regions.
The training principle of this unsupervised approach (see [HPM1]for details) consists in cutting every protein chains in overlapping fragments of 5 consecutive residues. Each fragment is then encoded both in terms of sequence (polarity, volume and hydrophobicity) and structure (sines and cosines of phi and psi dihedral angles). A fragment is so a vector composed of 31 values, 15 for the sequences and 16 for the structure (see Figure 1.1). A matrix named Hybrid Protein (see ref [HPM1, HPM3]) is built from these fragments, it has dimension of N sites (x-axis) by 31 (y-axis, see Figure 1.2).
The different fragments are learnt by the HP in their environment, meaning a fragment is used with the 6 previous and 6 following fragments (i.e., a window of 13 vectors). As for a SOM, a distance is computed at each N position to determine the best p position, position with a minimal distance (see Figure 1.3). Then, the positions are slightly modified to learn the presented example (see Figure 1.4). It is an iterative process, all the databank is presented for many cycles [HPM1]. The learning coefficient decreases with the number of used fragments. The size N was chosen after many test, it is a compromise between the minimal number of occurrences and the diversity of the clusters.
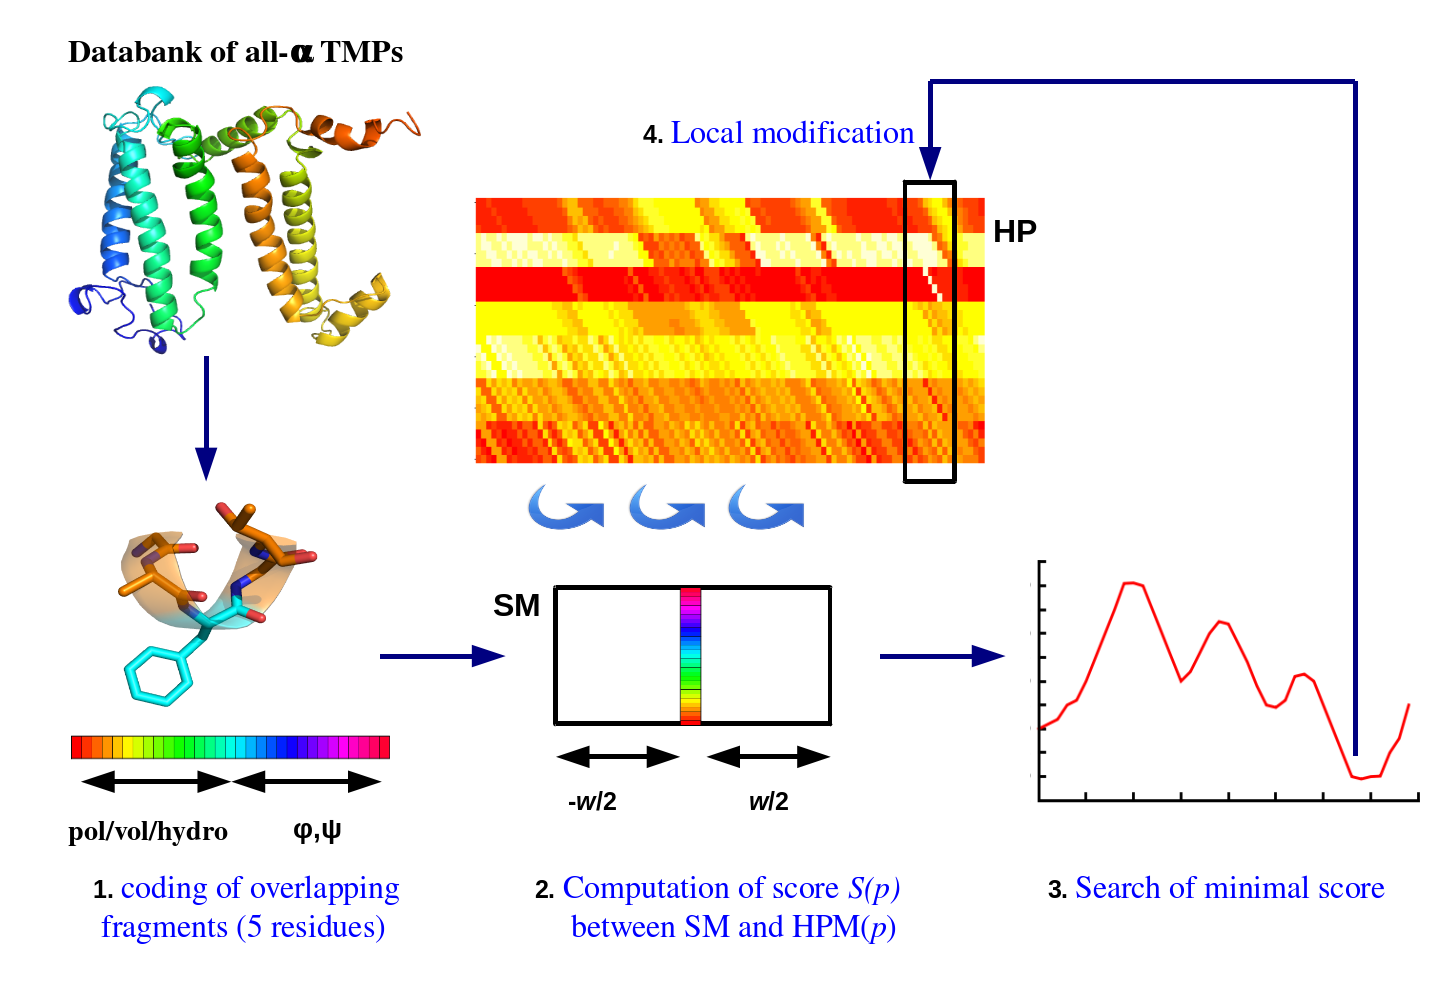
Figure 1. Learning approach HPM to study the sequence-structure relationship in transmembrane proteins.
(1) From the non-redundant databank, overlapping fragments of length 5 residues are generated. These fragments are coded in a vector of 31 components (5 for polarity, 5 for volume, 5 for hydrophobicity, 8 for cosine and sine of phi angles, 8 for cosine and sine of psi angles). (2) A matrix named Hybrid Protein (HP), is built from fragments chosen randomly. Then, all fragments are learnt along with their residue environment (window size, w=13). For each sub-matrix (SM), a Euclidean distance score is calculated on all positions of the matrix. (3) The position p with the minimal score is identified. (4) The position p and its local environment are modified to improve the agreement with SM.
Analysis of a structural model
This specific training of HPM on the sequence – structure relationship of all-α TMPs makes possible to use it to analyze protein structures as structural models of these TMPs. This last point is very important as the number of 3D structures of TMPs is quite limited and the selection of pertinent structural models is quite complex. The principle of HPMscore is so to encode the protein structural models in terms of sequence AND structure (see Figure 2.1), compute the distances at every position of the HP (see Figure 2.2) and search for each fragments the best positions (see Figure 2.3), i.e., the best sequence and structure.
The final HPM Score profile (see Figure 2.4) shows the distribution of the score values along the sequence. The HPM scores which correspond to the sum of all individual HPM score values reflect the general behavior of the protein structural models.
Using the dataset of the HOMEP2 database as a reference; we have shown the efficiency of the approach compared to other available tools. It was better than the DOPE methodology [DOPE] in x% of the case and equal in y%, given that in x+y% it is the best available approach at this day.
By design, the learning performed on well known structural folds is unbiaised, so it is expected to be also efficient on novel protein architectures.
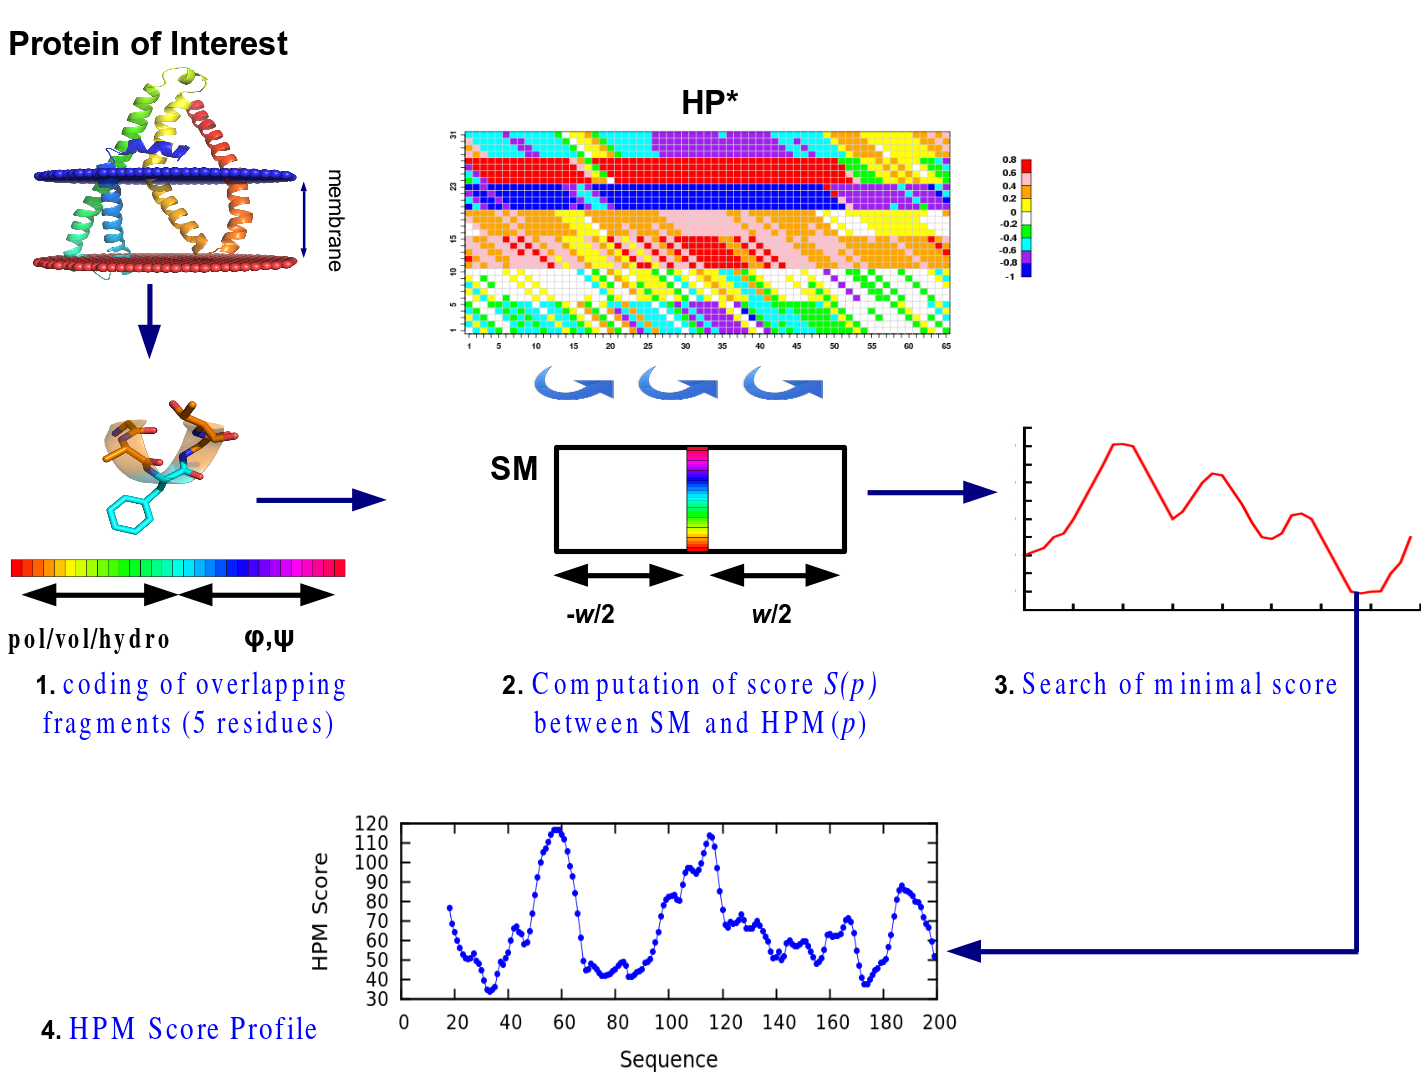
Figure 2. Assessment to the quality of 3D protein structures via HPM Score.
The main idea of the approach is to use the sequence – structure relationship of all-alpha TMPs learnt by HPM to (i) analyze and (ii) rank structural models of these TMPs. The principle is so very close from the learning of HPM (from Figure 1.1 to 1.3). For this purpose, one (or more) structural model(s) is (are) encoded in overlapping 5 residues fragments (see Figure 2.1), the Euclidean distance for a fragment is computed along the HP (see Figure 2.2) and the minimal distance is taken as the best sequence – structure match (see Figure 2.3). It gives the final distribution of HPMscore values (see Figure 2.4). The protein HPMscore, i.e. sum of all these scores, has been shown to be directly linked to the quality of the structural models; it is discriminative to select the best represent.
Performance
For a complete description of training, analyssi and evaluation of the approach, please see [HPMscore]. We have compared the performance of HPMscore against DOPE using perturbed alignements of membrane proteins contained in the HOMEP2 database. For each membrane protein available in this dataset, a perturbation-based method for alignments was used by introducing gaps or using amino acids permutations. On average, for each protein, 321 alignments were generated and ranged from 1 to 100% of sequence identity with the given protein. Then 25 models per alignment were produced using MODELLER with default parameters. DOPE function and HPM score were calculated for each model. For a given protein, the total model evaluation sums up to about 8000 models.
For each alignment the model closest to the experimentally determined protein structure (highest GDT_TS value) was selected for evaluation, i. e. HPMscore versus DOPE.
HPMscore was counted as better if the best model according to its HPM score had an higher GDT_TS value than the best model according to its DOPE score. In 11% of the evaluations, both scores selected the same model.
To assess the relative performance of HPMScore against DOPE in selecting the best model, we compared the ratio of both scores for every model. When the ratio is close to one, both methods were able to find the best model according to the GDT_TS criteria. A value above one is indicative of a better selection of the correct model by HPMScore, and a value below one is indicative of a better selection of the correct model by DOPE. As shown in Figure 3, HPMscore performs better than DOPE to discriminate correct models on a database of membrane proteins.
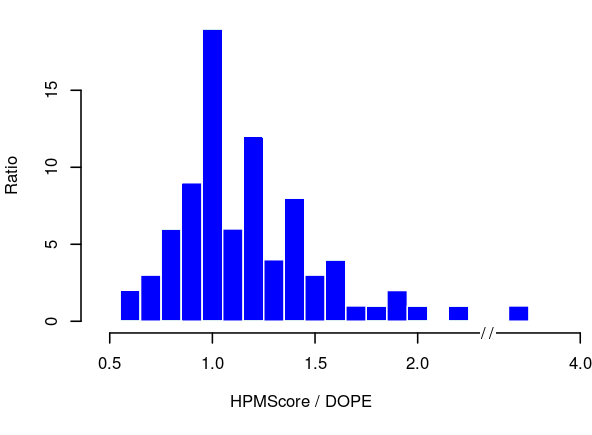
Figure 3. Histogram of the ratio between HPMScore and DOPE.
Graph of the ratio of HPMScore against DOPE on the selection of the best model for each protein in the HOMEP2 database. A value centered on one indicates that both method equally discriminate the correct model. HPMscore performs better when the value is upper than one, and DOPE is better when the ratio is lower than one.
Example
See the EXAMPLE section for a detailed view of the HPMscore webserver.
References
- [PDB]Berman HM, Bhat TN, Bourne PE, Feng Z, Gilliland G, Weissig H, Westbrook J. (2000) "The Protein Data Bank and the challenge of structural genomics." Nat Struct Biol. Suppl:957-9.
- [DOPE]Shen MY, Sali A. (2006) "Statistical potential for assessment and prediction of protein structures." Protein Sci. 15(11):2507-24.
- [KOHO1]Kohonen, T. (1982). Self-organized formation of topologically correct feature maps. Biological Cybernetics, 43:59-69.
- [KOHO2]Kohonen, T. (2001). Self-Organizing Maps. Third, extended edition. Springer.
- [HPMscore]Esque J., Urbain A., Etchebest C., de Brevern A.G. (2015). Sequence-Structure relationship study in all-alpha transmembrane proteins using an unsupervised learning approach. Amino Acids in press.
- [HPM1]de Brevern A.G. , Hazout S. (2000) "Hybrid Protein Model (HPM): a method to compact protein 3D-structures information and physicochemical properties." IEEE - Comp Soc (2000) S1, 49-54
- [HPM2]de Brevern, A.G. and Hazout,S. (2001) Compacting local protein folds with a hybrid protein. Theor. Chem. Acc., 106, 36–47.
- [HPM3]de Brevern,A.G. and Hazout,S. (2003) 'Hybrid Protein Model' for optimally defining 3D protein structure fragments. Bioinformatics, 19, 345-353.
- [HPM4]Benros C, de Brevern AG, Etchebest C, Hazout S. (2006) "Assessing a novel approach for predicting local 3D protein structures from sequence." Proteins. 62(4):865-80.
- [HPM5]Bornot,A., Etchebest,C. & de Brevern,A.G. (2009) A new prediction strategy for long local protein structures using an original description. Proteins: Structure, Function, and Bioinformatics 76, 570–587.
- [PFLEX1]Bornot A, Etchebest C, de Brevern AG. (2011) "Predicting protein flexibility through the prediction of local structures." Proteins. 79(3):839-52.
- [PFLEX2]de Brevern A.G., Bornot A., Craveur P., Etchebest C., Gelly J.-C. (2012) "PredyFlexy: Flexibility and Local Structure prediction from sequence." Nucleic Acid Res. 40:W317-22.