1. Introduction
The HPM score is an indicator of the pertinence of a model according to our approach, namely Hybrid Protein Model, which was specifically designed with a database of all-α membrane proteins. The user gives structural models which are ranked according to our distance measure. The lowest score indicates a better model, while highest scores are models with less confidence.
We present in this page how to use the web server. The description of the method is available in the ABOUT section.
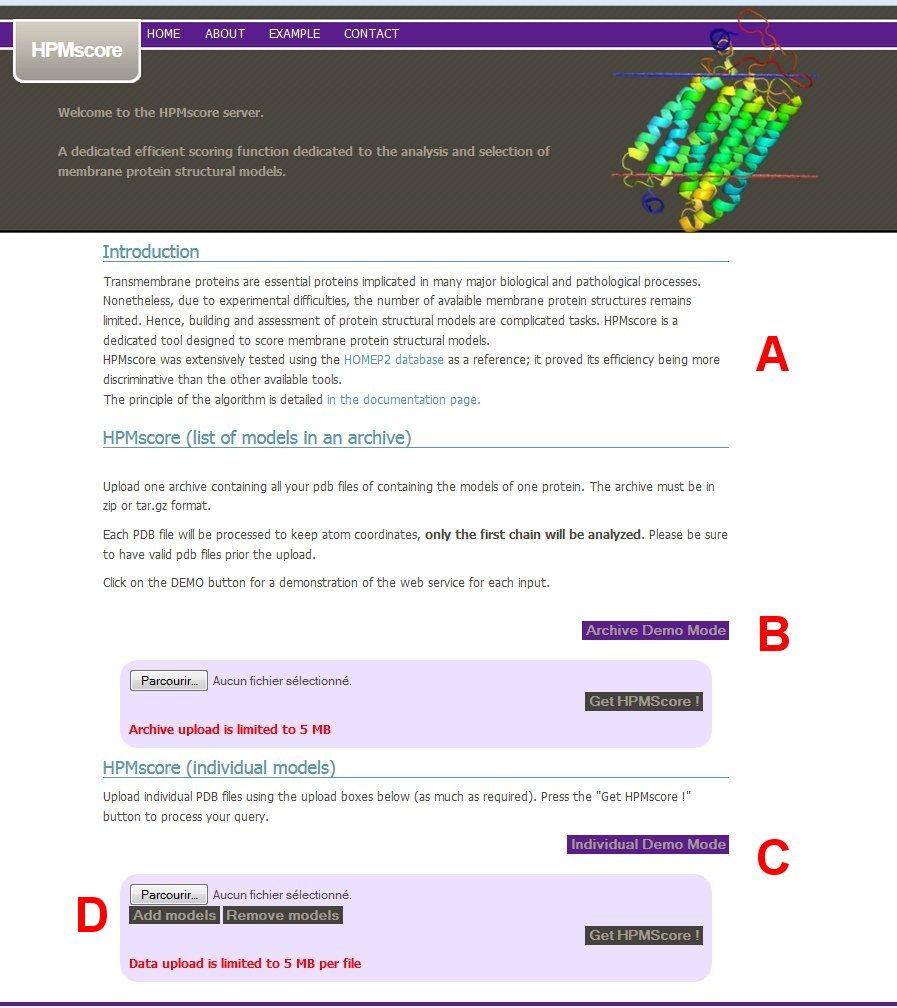
The webpage for the use of HPMScore is the HOME page. The first part of the page is a short introduction to HPMSCore (A). The user is invited to upload (B) an archive file containing all models of a given protein, or (C) a list of individual model files.
2. Input and data formats
Each file is expected to be a text file, or an archive containing text files in pdb format. See the complete PDB format definition for more details, or here for a simple PDB file:
EXPDTA    THEORETICAL MODEL, MODELLER 9.11 2013/10/10 15:56:15
REMARK   6 MODELLER OBJECTIVE FUNCTION:      2070.5232
REMARK   6 MODELLER BEST TEMPLATE % SEQ ID:  52.444
ATOM      1  N   MET     1       5.767   5.839  41.718  1.00 89.58           N
ATOM      2  CA  MET     1       7.096   5.424  42.223  1.00 89.58           C
ATOM      3  CB  MET     1       7.442   4.013  41.720  1.00 89.58           C
ATOM      4  CG  MET     1       6.500   2.925  42.239  1.00 89.58           C
ATOM      5  SD  MET     1       6.886   1.257  41.628  1.00 89.58           S
ATOM      6  CE  MET     1       5.491   0.454  42.468  1.00 89.58           C
ATOM      7  C   MET     1       8.140   6.361  41.717  1.00 89.58           C
ATOM      8  O   MET     1       7.905   7.562  41.594  1.00 89.58           O

[...]

ATOM   1694  N   GLU   225      19.358   6.108  -9.450  1.00 20.53           N
ATOM   1695  CA  GLU   225      18.932   4.743  -9.349  1.00 20.53           C
ATOM   1696  CB  GLU   225      18.911   4.190  -7.912  1.00 20.53           C
ATOM   1697  CG  GLU   225      20.299   4.108  -7.272  1.00 20.53           C
ATOM   1698  CD  GLU   225      20.139   3.548  -5.864  1.00 20.53           C
ATOM   1699  OE1 GLU   225      19.020   3.068  -5.541  1.00 20.53           O
ATOM   1700  OE2 GLU   225      21.139   3.580  -5.097  1.00 20.53           O
ATOM   1701  C   GLU   225      17.509   4.678  -9.885  1.00 20.53           C
ATOM   1702  O   GLU   225      17.314   5.016 -11.082  1.00 20.53           O
ATOM   1703  OXT GLU   225      16.599   4.289  -9.105  1.00 20.53           O
TER    1704      GLU   225
END
Only the model coordinates are considered for the HPM score computation, some comment headers are also kept for reference of the input model, for example if models were produced using MODELLER.
Any file not conforming to these requirements is discarded and a notification about these problematic files is displayed.
Pay also attention to the maximum upload size, if your archive or pdb file is bigger than 5MB, it will be automatically be discarded from the HPM score computation, and if you use the multiple input facility, no score will be computed.
3. Upload of an archive file
An archive is an easy way to test an important number of structural models. Archive files must contain PDB files, others will not be used. zip and tar.gz format are used.
(B) Click on the “upload” button to select your archive file. The server will then proceed rapidly to the upload of your file and process the archive according to the rules seen previously. Do not upload a plain PDB file or it will not be considered by this form.
Once your archive file is selected, press the “Get HPMScore!” button to get the server processing your archive. (Go to 8 to analyze the results).
4. Upload of individual files
(C) Users can also use the dynamic form to upload single or multiple file. By default only one upload entry is displayed but more upload entries can be add by clicking on the “Add models” button (D).
Be sure that the total size of you upload does not sum up to more than the maximum upload size, or no HPMscore will be performed for your models.
Once all your files are uploaded, press the “Get HPMScore” button to launch the HPM score calculation. (Go to 8 to analyze the results).
5. Demo mode
An example of the HPM server webserver usage can be directly accessed thanks to the “Demo Mode” buttons. An example of an archive or of an individual file is provided. The user has only to press the button and he will access to example results.
6. Processing of your files
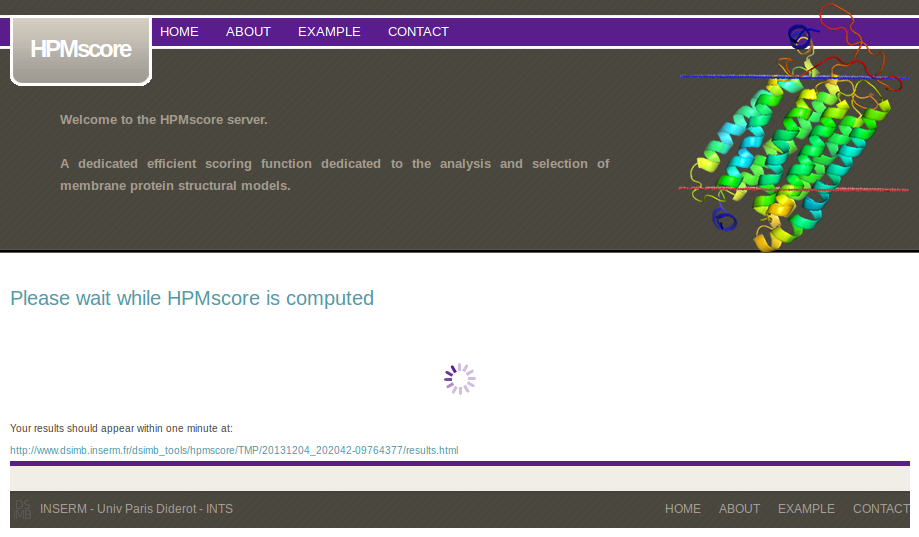
Once your files are uploaded to the server, the HPM score analysis is performed and a waiting page is displayed. Each HPMscore computation and the creation of the results page will be performed in about half a minute per model.
Hence, if a lot of models has been uploaded, roughly a maximum of 100 hundred PDB files in an archive, the total time may rise to half an hour. In this case, just bookmark the provided link, and come back later, the calculations will be still performed in background if the waiting page is closed. Otherwise leave the waiting page open, it will refresh automatically and display the results page when computations will be finished.
7. Data conservation
Each job is publicly accessible through a unique job identifier, is kept for a maximum period of two months. After your job is completed, you are strongly encouraged to download the provided archive of your results. The description of the archive content is detailed below.
8. Results overview
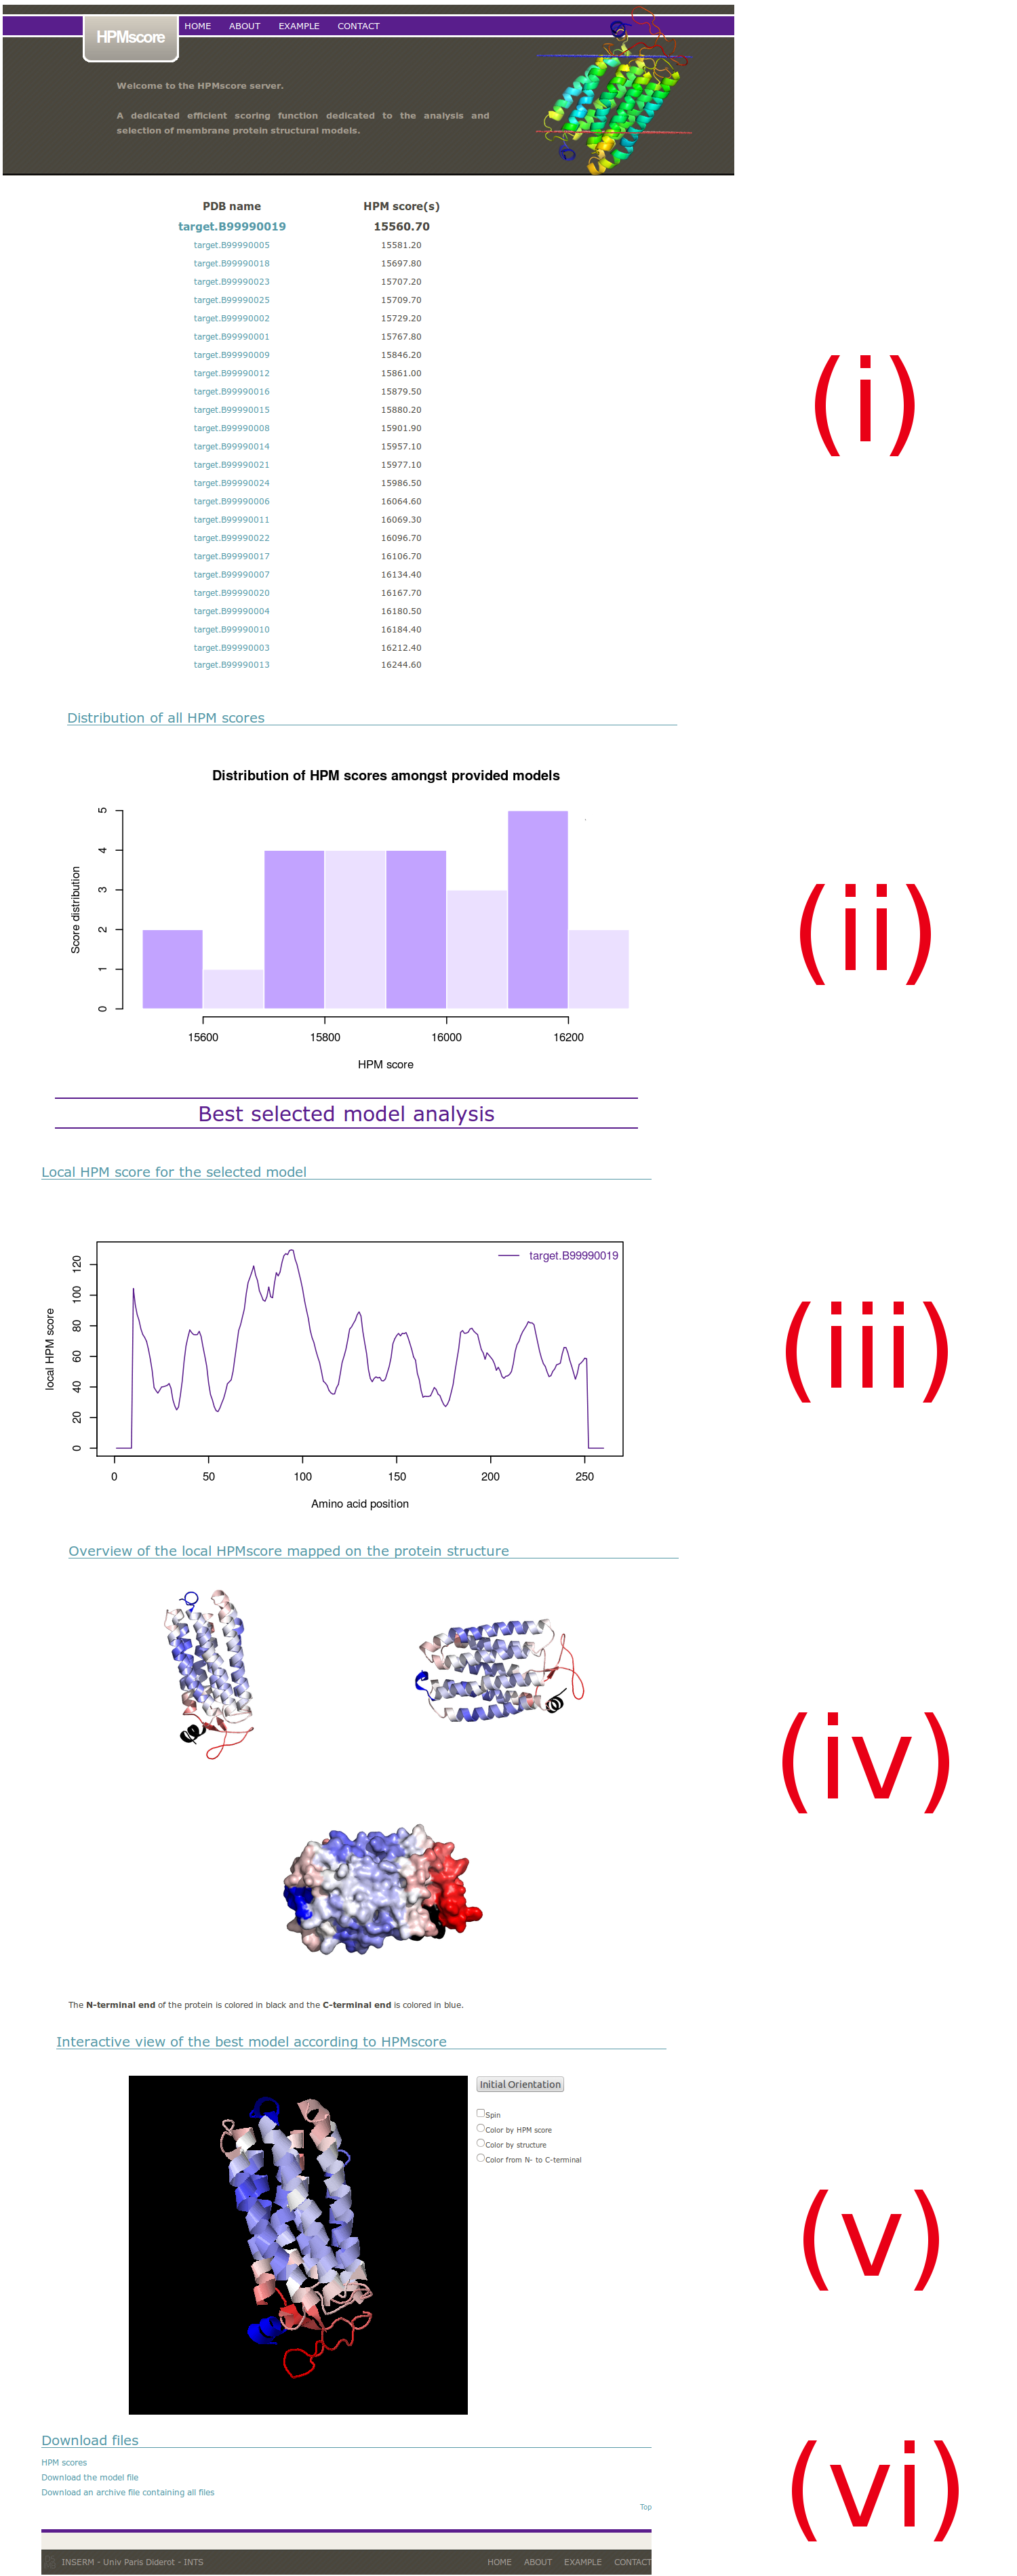
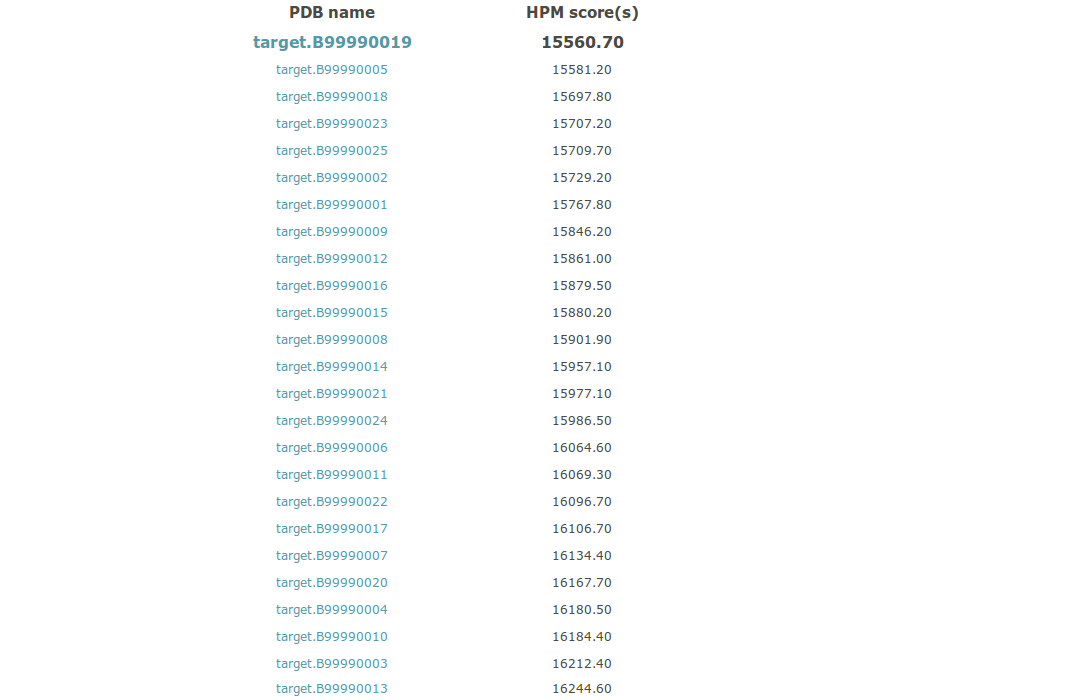
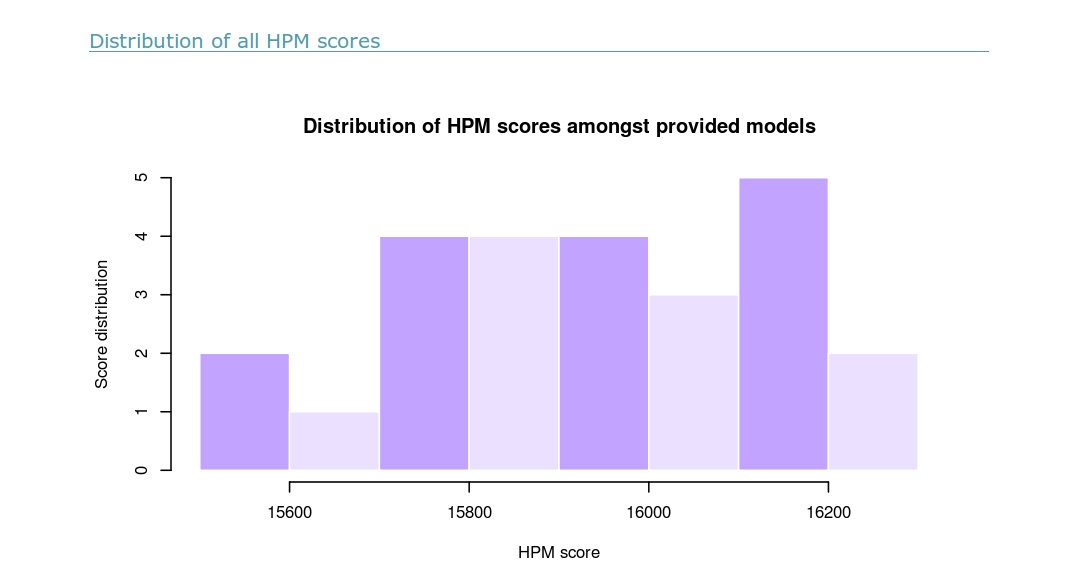
(i) A table is provided. It ranks all the structural models from the best to the worst HPMScore. The name of the structural model is given with its HPMScore (sum of all HPMScore values along its sequence). A hyperlink is provided for each structural model to give more insight on each model (see 9 for more details).
The Table in csv format is provided in the archive download link (see vi).
(ii)
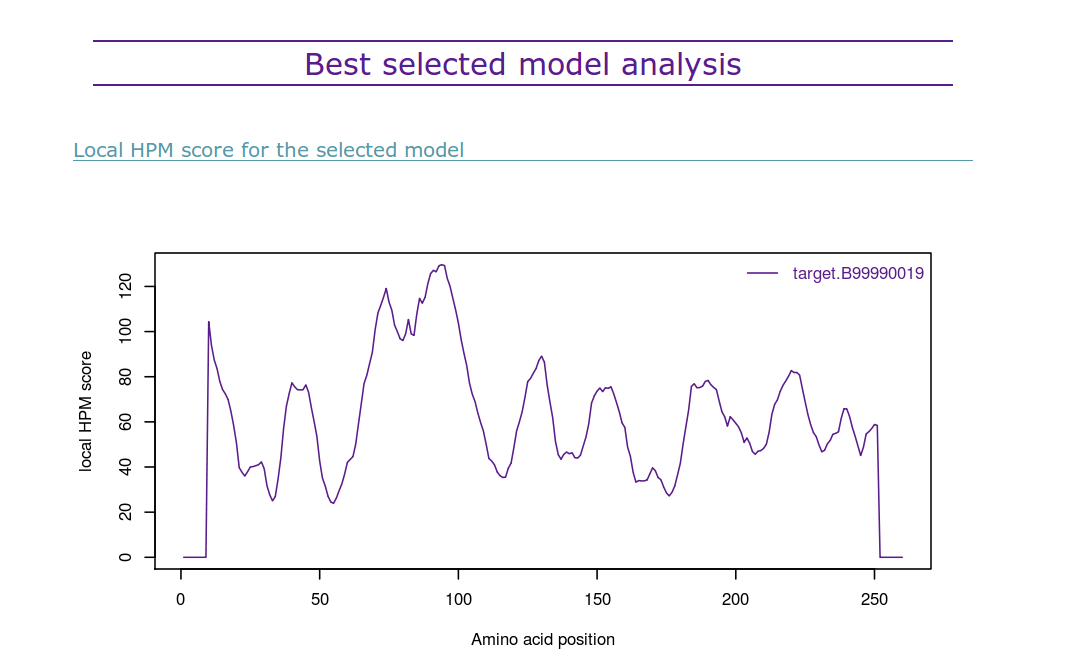
Below it the best structural model according to HPMScore is presented:
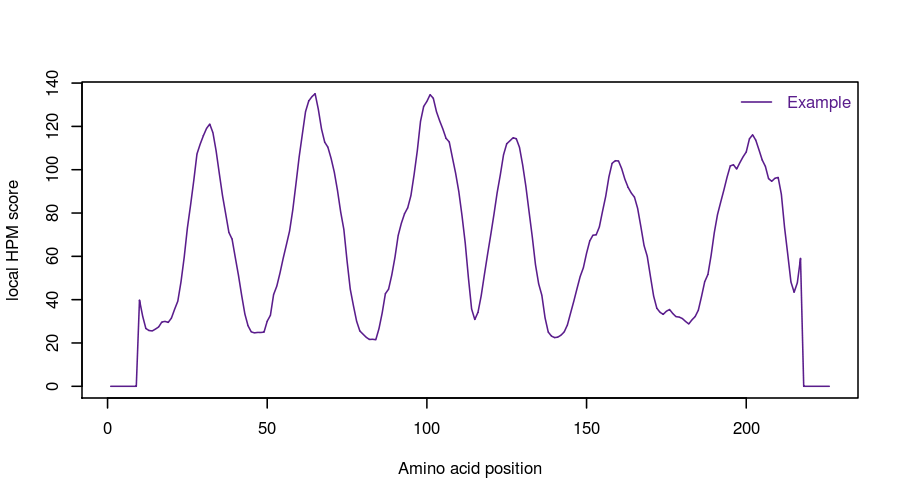
(iii) The HPMScore used to assess the global quality of each structural model is, in fact, the sum of each local HPMScore values along the protein sequence (see ABOUT section for more details). This display of the HPMscore along the protein sequence allows a direct identification of the regions where the protein structure is considered of better (low values) or lower (high values) quality. It is useful to compare it with other similar plot for other selected structural models (user can have access to it by clicking on the name of the structural model in the table).
The R script used to create this diagram is included in the provided archive download link.
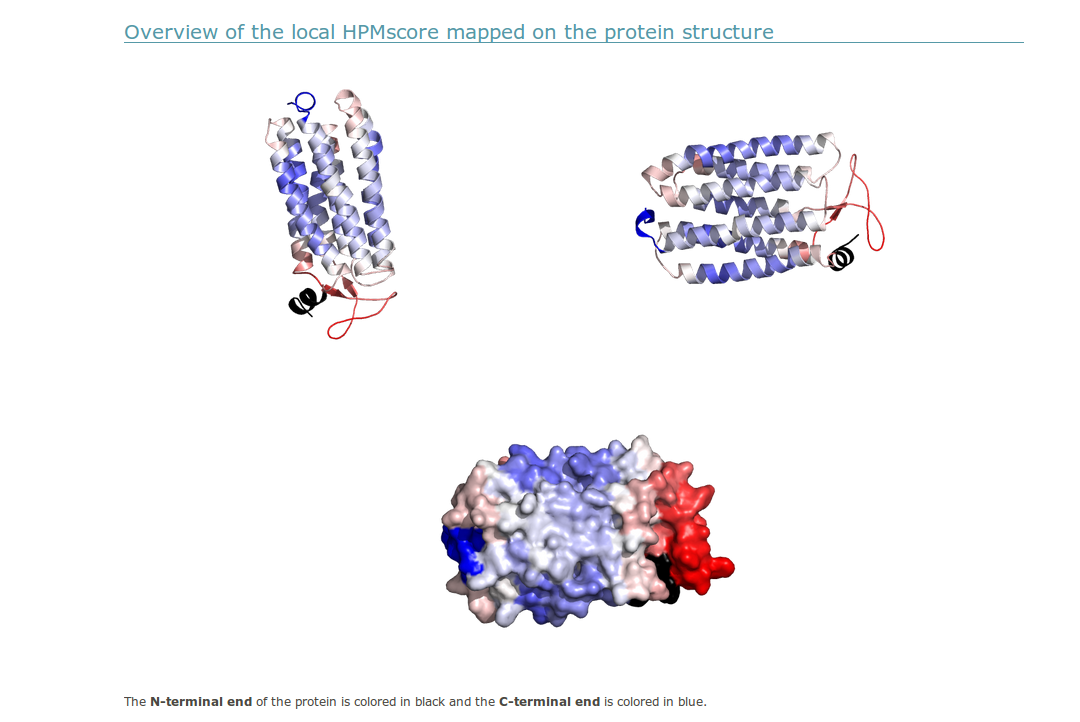
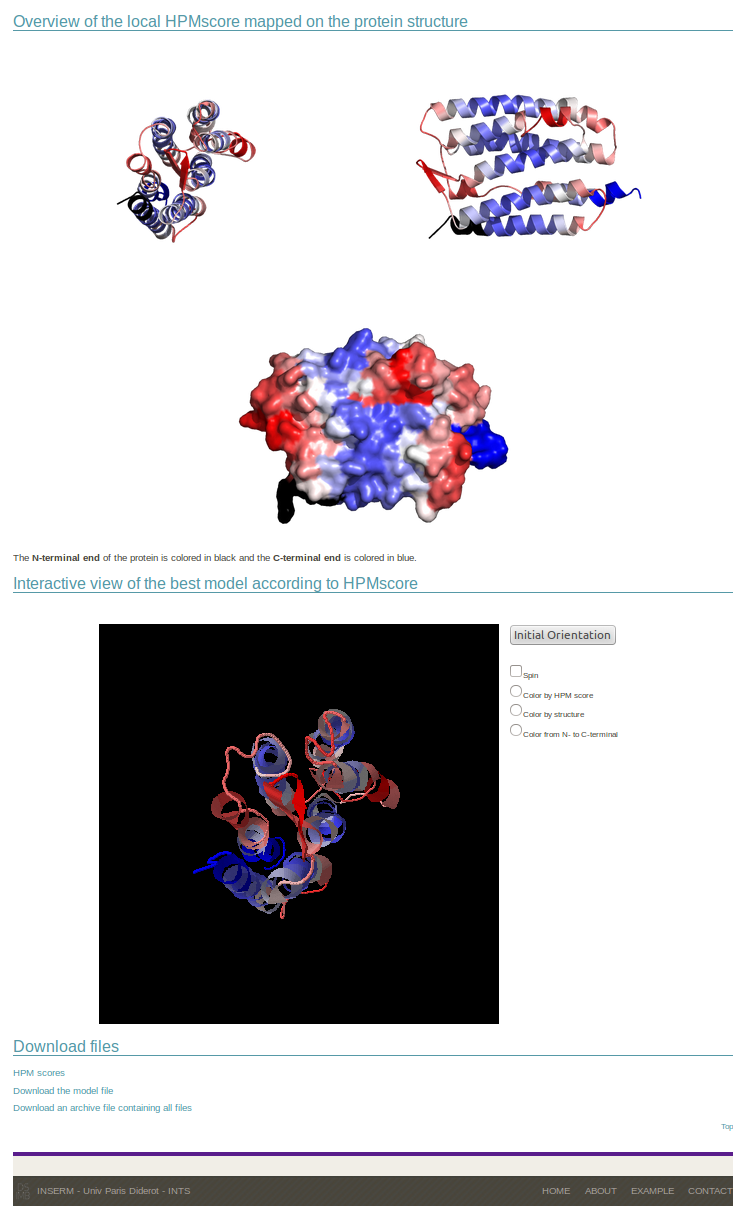
(iv) A PyMOL visualization is provided. Each view allows a comparison of the low HPM score values in blue and high HPM score values in red. To help the user in identifying the position of the N-terminal and C-terminal ends of the proteins, they are colored in black and dark blue, respectively.
The protein orientation presented is directly taken from the input PDB file. If the user wants a different orientation of its PDB file, she/he must first change the orientation of the input PDB files which will be then presented in this new orientation in the server display. In order to offer a better coverage of the protein model, the protein is re-oriented using the pymol “orient” command. This will rotate the input protein to display the model along the viewport’s z axis.
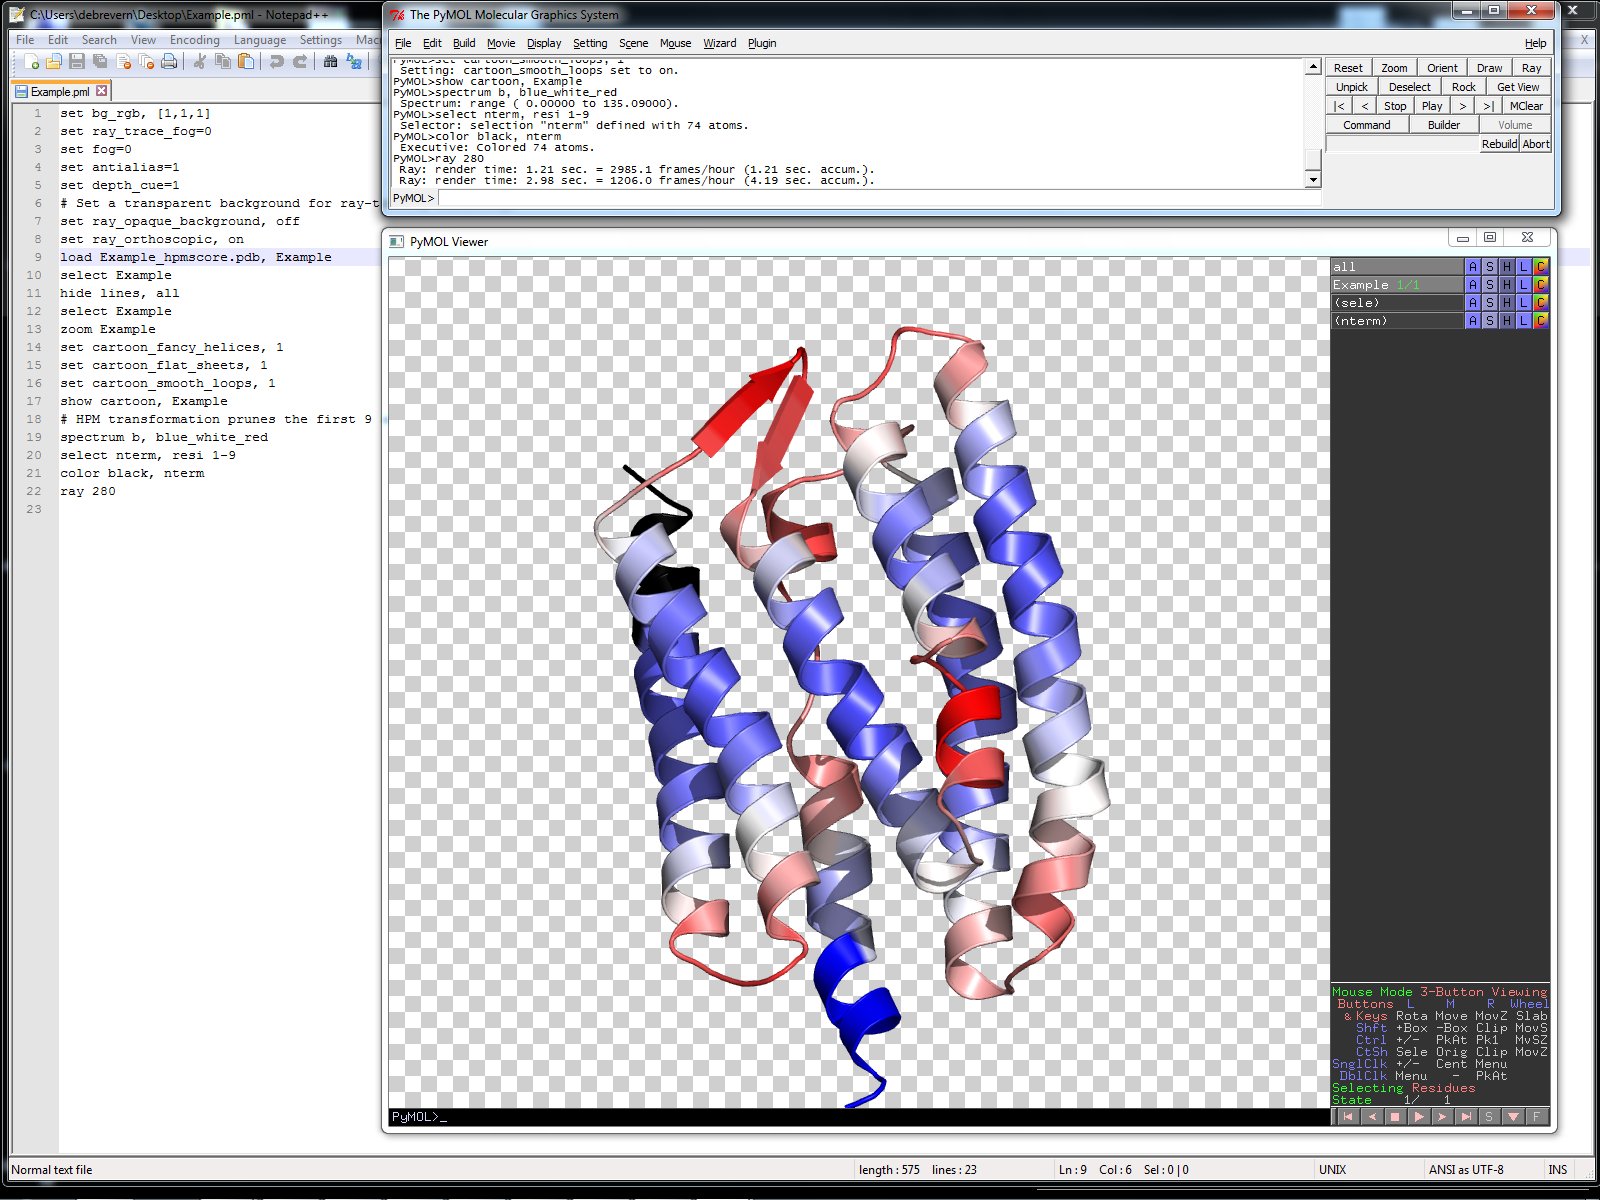
The PyMOL scripts used to create these Figures are included in the provided archive. It allow a rapid interaction with the provided model since PyMOL is quite intuitive to use.
(v) In order to allow a more flexible orientation of the protein for a more complete analysis of the model quality as computed using the HPM approach, an interactive view of the protein is displayed using a Jmol applet. The default coloring scheme is consistent with the view presented in the PyMOL images, where blue values indicate a low HPM score, and red values indicate a high HPM score. An alternative coloring scheme is presented so the user can easily recognize the protein organization if the HPM score mapping renders the display too complicated.
Please note that the coloring scheme is similar in both views but differences may appear since pymol and jmol may render the temperature factor, where the HPM score is stored on the PDB file, differently.
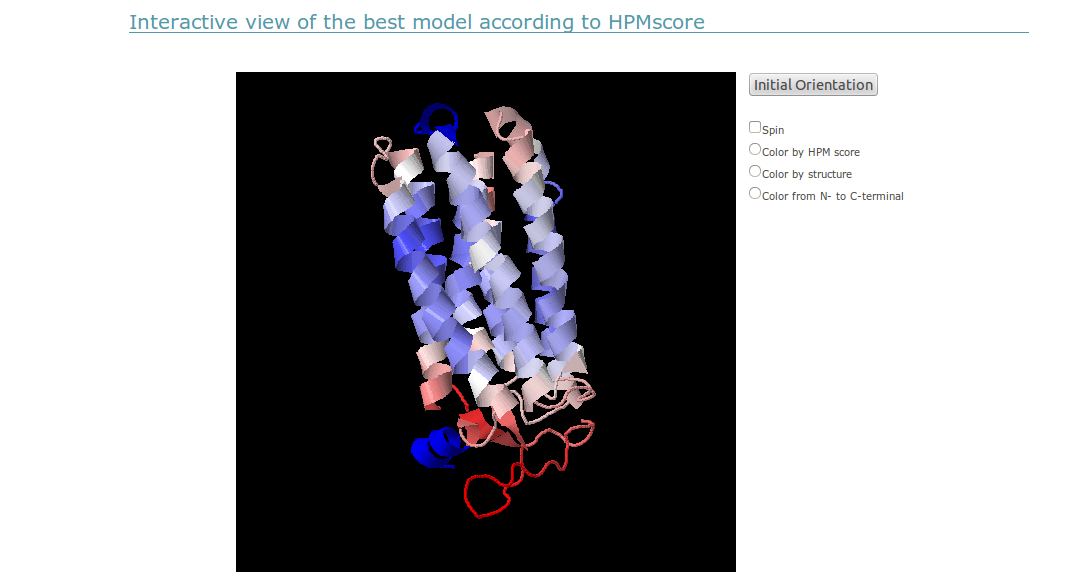
Please note that Jmol needs a dedicated Java environment, you can check if your browser is compatible on the upstream Oracle Java website.
(vi) Most of the results are stored in an archive. Please see section 10 for more details.
You can see a complete archive by clicking here or here for results of an archive containing valid and unvalid PDB files.
9. Results overview for an individual structural model.
For an individual model, only its own score is provided. The following information are similar to the one provided for the best model (see before). The local HPM score for the best model is displayed.
It is followed by a static mapping of the local HPM score on the structure visualized as cartoon and surface representations thanks to PyMOL software. An interactive JMol representation allows the direct manipulation of the model, the coloring scheme is presented by default as in the static images, and all results can be downloaded.
You can see a complete pdb report by clicking here or the error page when the PDB file is not recognized properly or if HPM score failed.
10. Download section
HPM scores in Comma Separated Values format (CSV)
The user is offered to download individual files for a rapid examinations of the HPM scores, like the “data.csv” output, where model filenames are displayed one per line, and their respective HPM score follows the file name by a comma.
Example:
model.pdb,14152.48
Individual Model download
This link will provide a direct access to the displayed model file. A local HPM score value in inserted for each amino acid position in the temperature factor column.
For a more complete description of this field, see the complete ATOM record description in the PDB format description.
Download all files in one archive
On the main HPM score results page, the last download link contains all models, images and scripts used to generate images: R and pymol scripts. This archive is the easiest way to download all informations in one place.
Errors
We made our best to test the robustness of our server concerning model of proteins coming from different sources, including files originating from the PDB, MODELLER, I-TASSER, ROSETTA, …
When a file is not properly recognized during the HPM score computation, an error message will be displayed, or the file itself will be ignored and marked as discarded in the results page.
If you think you have uploaded a valid pdb file but fail to obtain its HPM score, do not hesitate to contact us, by following the instructions displayed on the contact page.