| PDB name | HPM score(s) |
|---|---|
| target.B99990019 | 15560.70 |
| target.B99990005 | 15581.20 |
| target.B99990018 | 15697.80 |
| target.B99990023 | 15707.20 |
| target.B99990025 | 15709.70 |
| target.B99990002 | 15729.20 |
| target.B99990001 | 15767.80 |
| target.B99990009 | 15846.20 |
| target.B99990012 | 15861.00 |
| target.B99990016 | 15879.50 |
| target.B99990015 | 15880.20 |
| target.B99990008 | 15901.90 |
| target.B99990014 | 15957.10 |
| target.B99990021 | 15977.10 |
| target.B99990024 | 15986.50 |
| target.B99990006 | 16064.60 |
| target.B99990011 | 16069.30 |
| target.B99990022 | 16096.70 |
| target.B99990017 | 16106.70 |
| target.B99990007 | 16134.40 |
| target.B99990020 | 16167.70 |
| target.B99990004 | 16180.50 |
| target.B99990010 | 16184.40 |
| target.B99990003 | 16212.40 |
| target.B99990013 | 16244.60 |
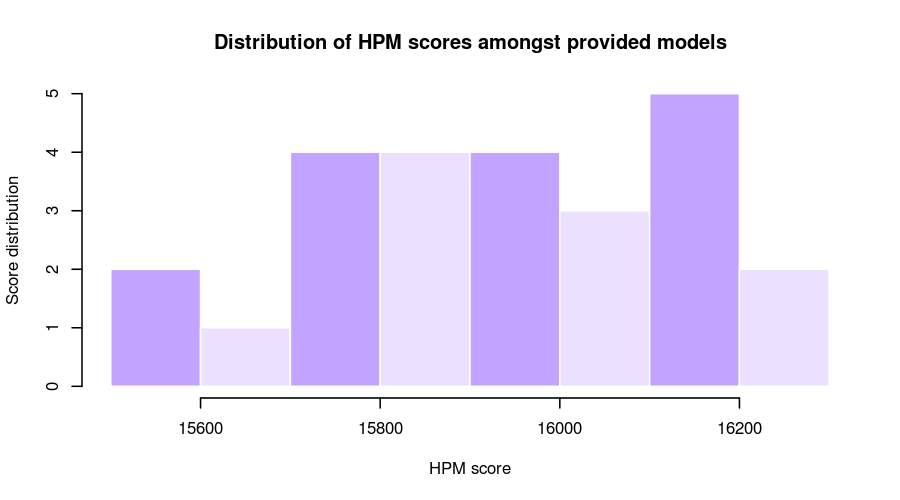
Distribution of all HPM scores
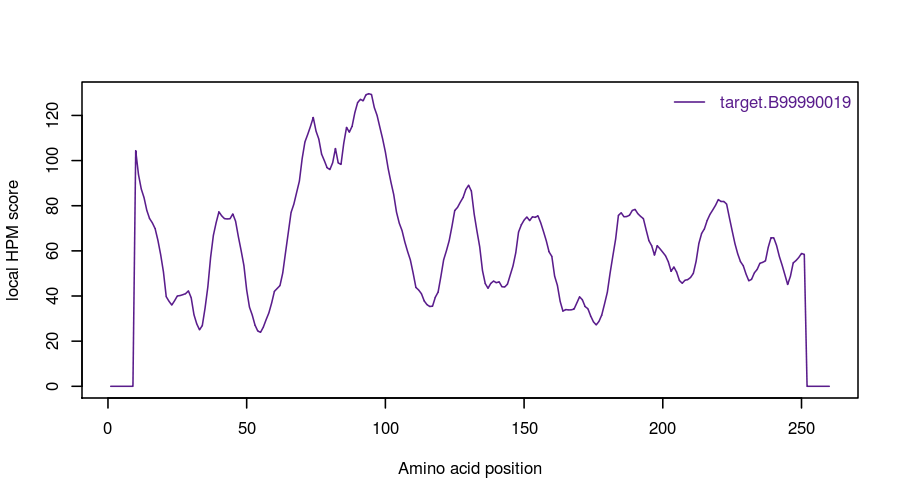
Best selected model analysis
Local HPM score for the selected model
Overview of the local HPMscore mapped on the protein structure

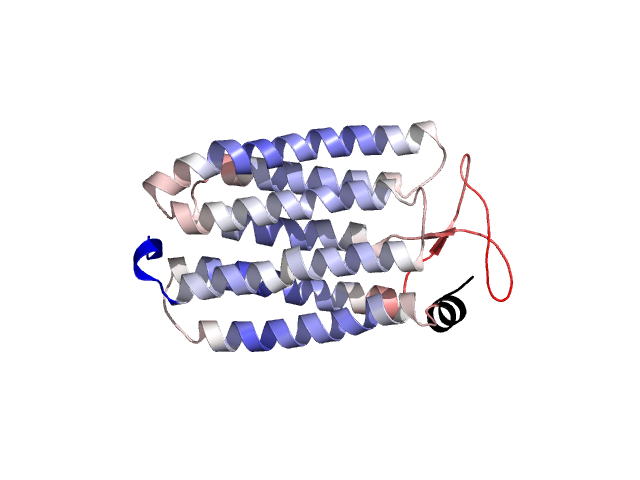
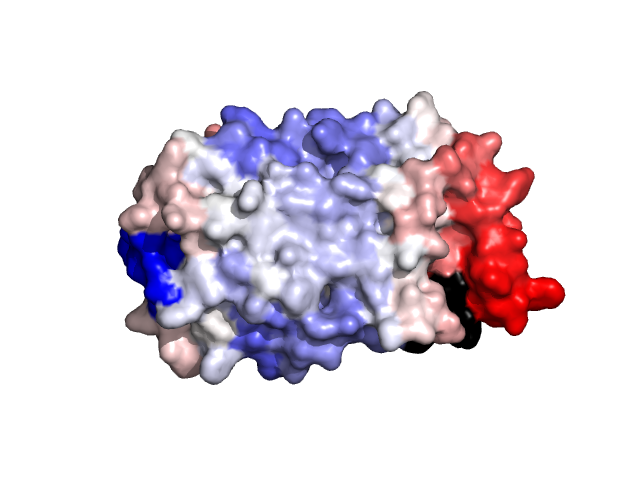
The N-terminal end of the protein is colored in black and the C-terminal end is colored in blue.