Introduction
Voronoi Laguerre Delaunay Protein webserver (VLDPws) is an efficient method dedicated to the analysis of protein structures using metric and geometric/topological measurements. It s based on the Laguerre tessellations which is computed after the system has been surrounded by a set of water molecules modelling a solvent. The a panel of properties are deduced: (i) protein contacts, (ii) residue volumes, (iii) residue accessibility and (iv) a collection of data to visualize the protein structure either interactively or non-interactively. Hence two modes are available to get the results: (A) online (selecting the most important information) and (B) in files available for download (containing all the different information). The major interest of VLDP is its simple way to analyze the protein structure folds, by looking at their packing, accessibility and porosity.
A-Online Laguerre Tessellation and Analysis
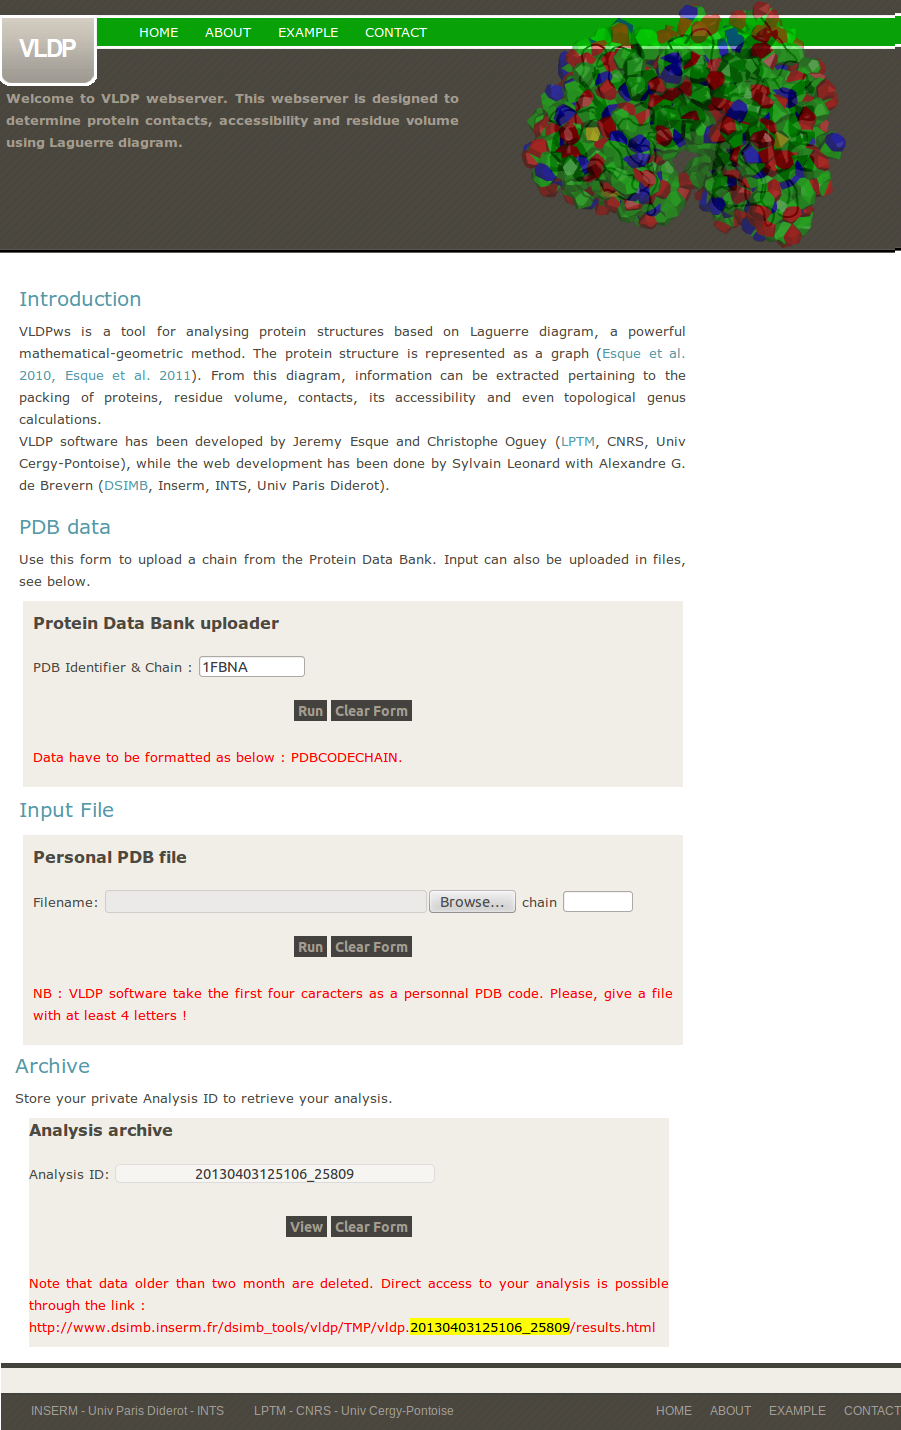
1- Front page
VLDPws takes as input a set of coordinates of a protein chain (in Protein DataBank format) for which it will perform the Laguerre tessellation.
2- Errors / computation
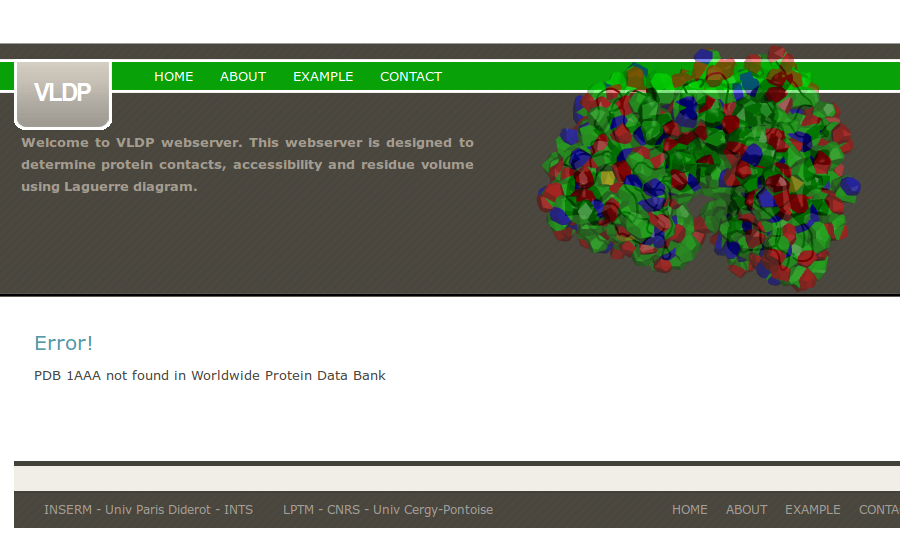
If the PDB is not found in the Worldwide PDB Databank, VLDPws computation stops.
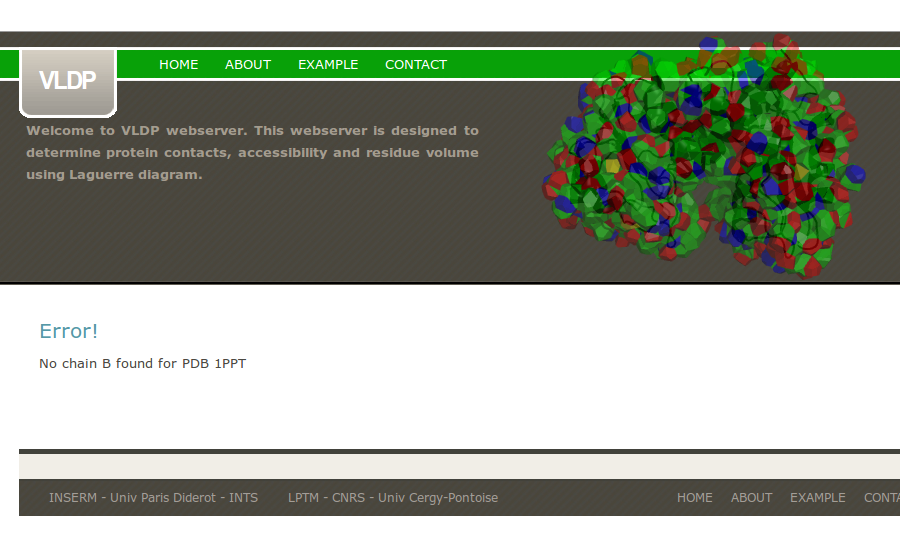
If a wrong PDB chain is given, VLDPws computation fails.

If a PDB chain was not mentioned, VLDPws computation fails.
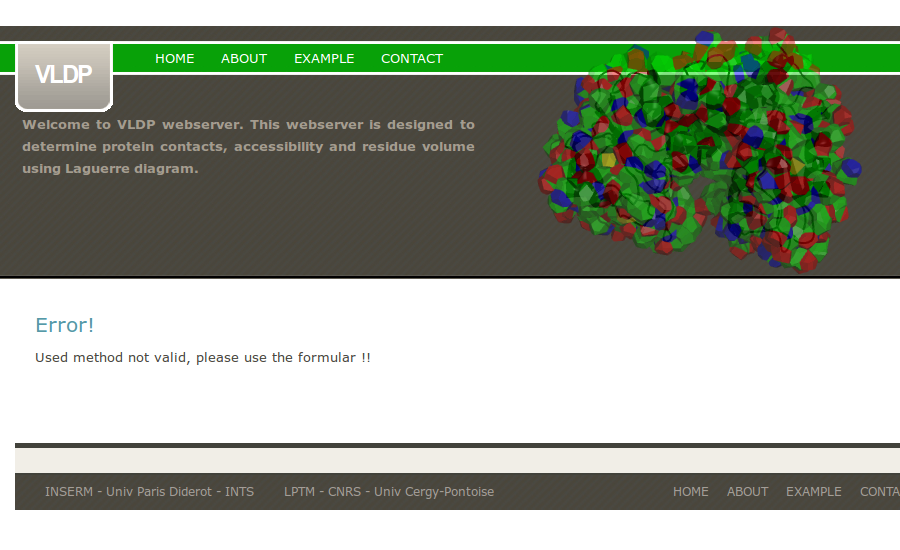
If the uploaded pdb file is too large, VLDPws computation fails.
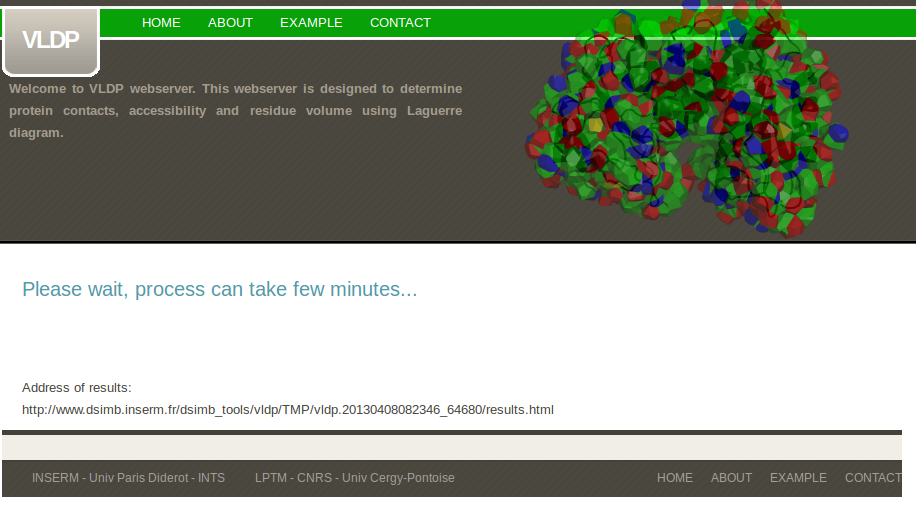
If everything is good, the script is launch and a wait page appears. This page is automatically updated until the calculation is finished (takes several minutes).
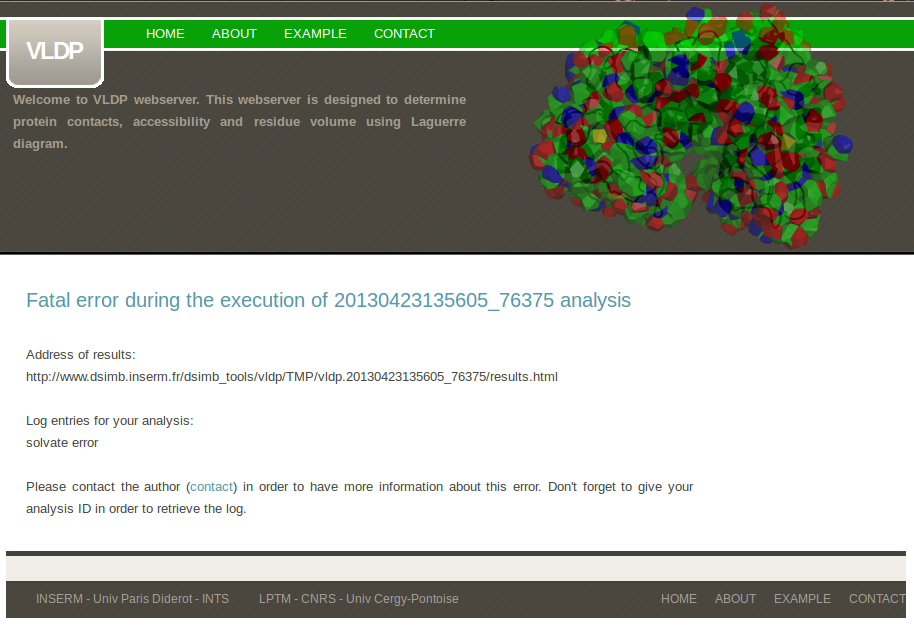
In case of error during the execution of VLDP binary, the waiting will crash and this page will appears. The page indicates the theoretical address of the results, the summary log entries with the error and a link the found the author mail in the case you want more information about the error.
3- Results and Outputs
The complete output of VLDP contains five main parts :
1. The protein
2. Proteins contacts
3. Volume and Area
4. Accessibility (PIA)
5. Interactive visualization
We now describe the different part:
1. The protein

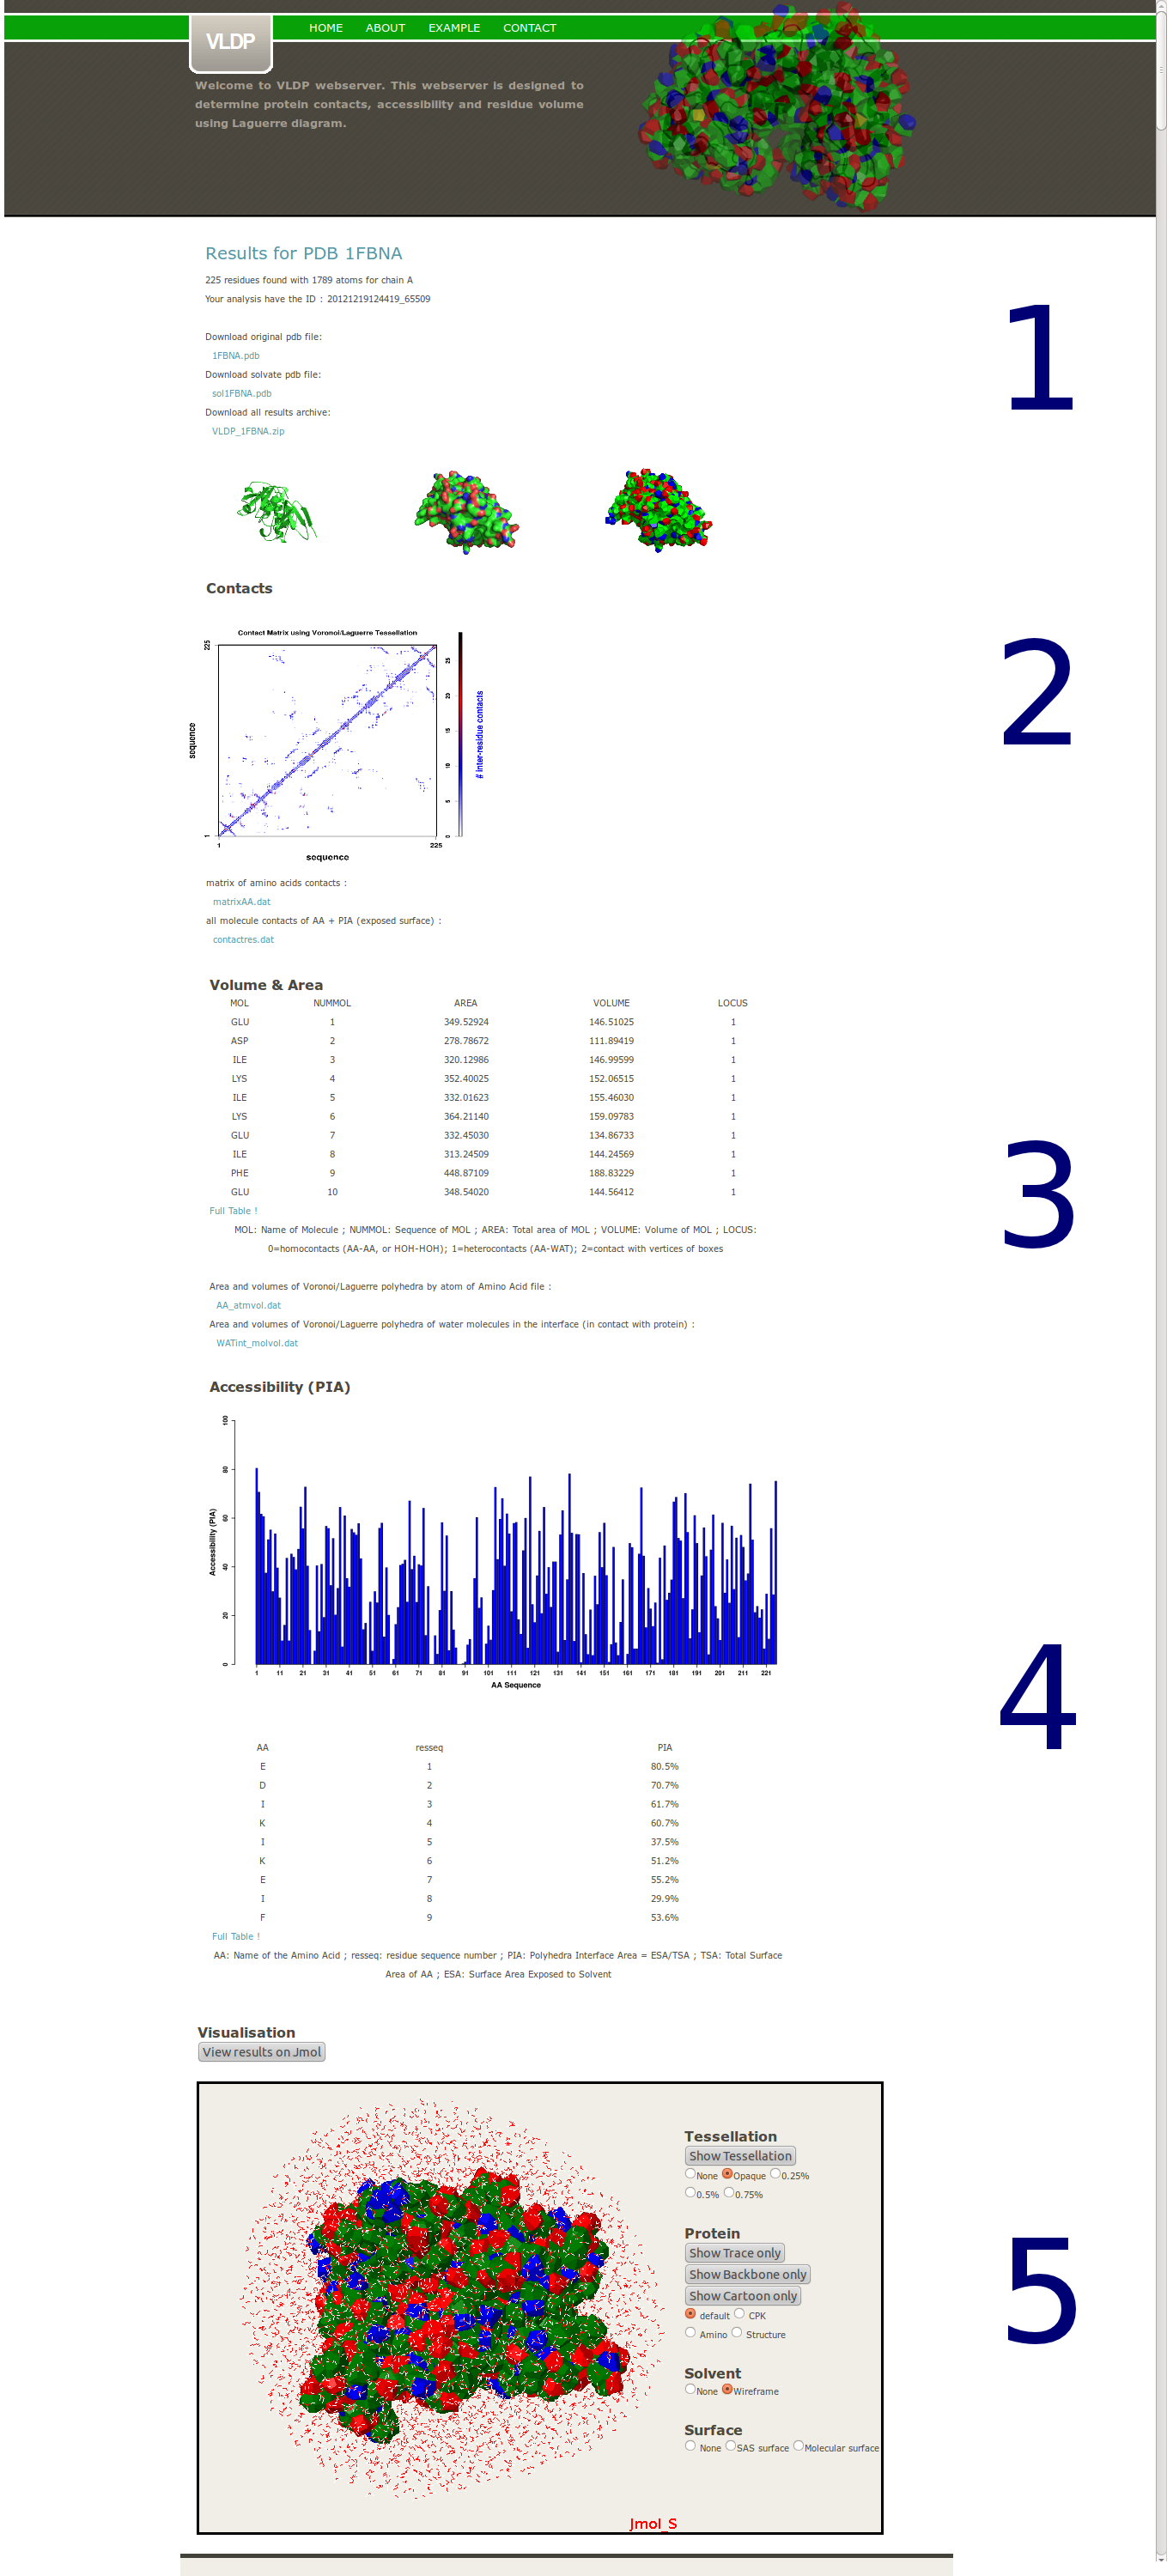
First a summary provides the name of the protein, the sequence length and the number of atoms used. For checking purposes, a copy of the input PBD file and the complete data with the solvent used for the Laguerre computation can be also downloaded. All results can be downloaded in an archive file (zip format).
2. Protein contacts
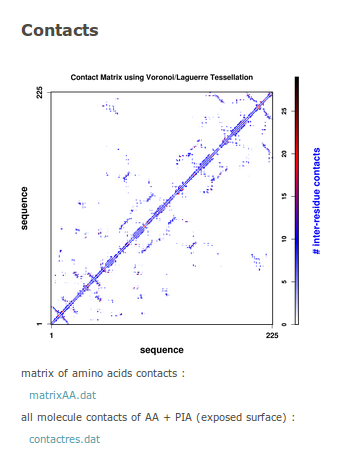
The contact map is provided as an image. As a residue is composed of numerous atoms, we provide a quantification of common area between all the atoms of each residue. A blue scale legend gives the number of contacts. The contact matrix can be downloadedin text formatted file named matrixAA.dat. A more complete information on these contacts (exposed surface, total surface area of amino acid, neighbourhoods of each amino acid, both sequence and type) is contained in the contactres.dat (text format).
3. Volume and Area
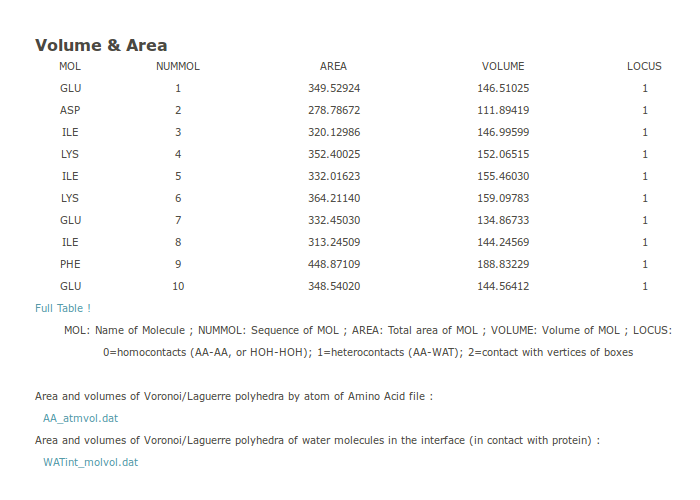
From the Laguerre diagram with finely tune parameters, one can get accurate values of the volume of each residue. The volumes are given as a Table (only partially shown on the webpage). It can be seen interactively and downloaded (the file is named AA_atmvol.dat). An extra column named LOCUS gives information about the residue contacts: 0: buried residue, 1: residues exposed to solvent, 2: residue on the boundary of the system. Also provided is a file listing the water molecules in the first layer around the protein, i.e., molecules in contact with residues at the surface of the protein (the file is named WATint_molvol.dat).
4. Accessibility
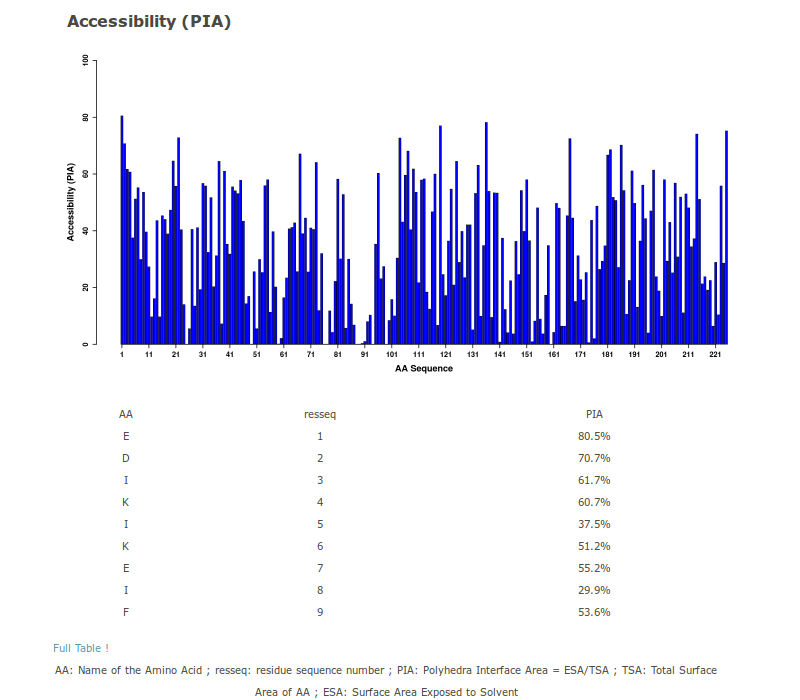
PIA is an accessibility measure assessed in [Esque et al, 2011]. For an amino acid i, the accessibility is calculated as follows: PIA= As / (As + Ab), where As is the surface exposed to solvent (sum of face areas of AAi in contact with water), and Ab is the buried surface (sum of face areas of AAi in contact with other residues j). PIA is plotted as a barplot. The table can be downloaded as a file.
5. Interactive visualization
The Jmol applet displays the protein in various views. Several options are available and are clustered in 4 groups:
1- Tessellation: The “Show Tessellation” button shows the Laguerre surface. Four transparency levels are proposed (0, 0.25, 0.5 and 0.75). The polyhedron colour is the following: blue (N), green (C), red (O) and yellow (S).
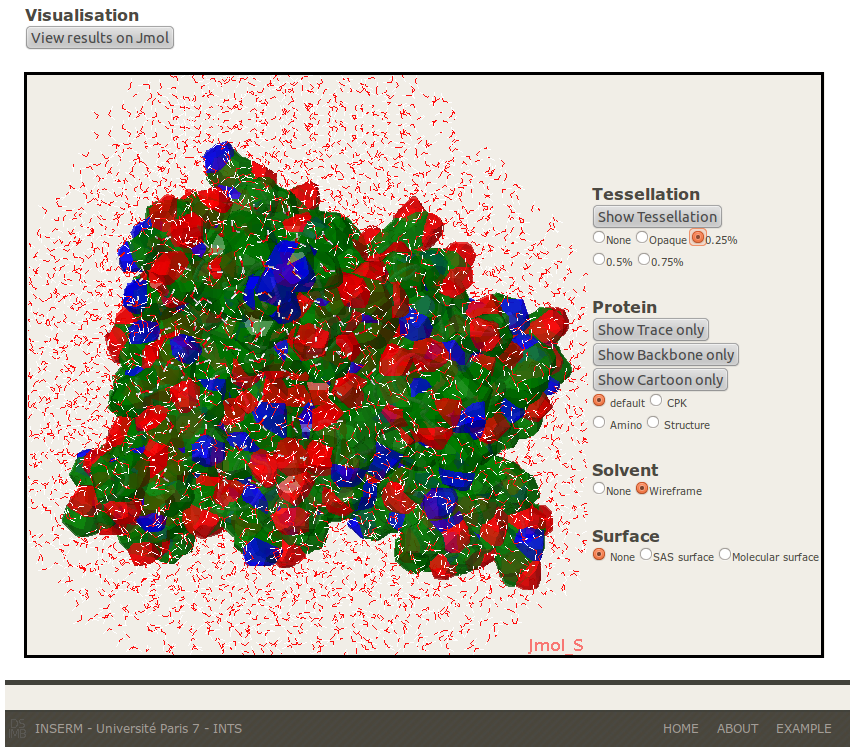
2- Protein: To visualize the protein in different renderings (Trace, Backbone, Cartoon) and different sets of colour according to the atomic kind (CPK), the Amino Acid species (Amino) or the Secondary Structure (Structure).
3- Solvent: To show or hide the solvent in wireframe model.
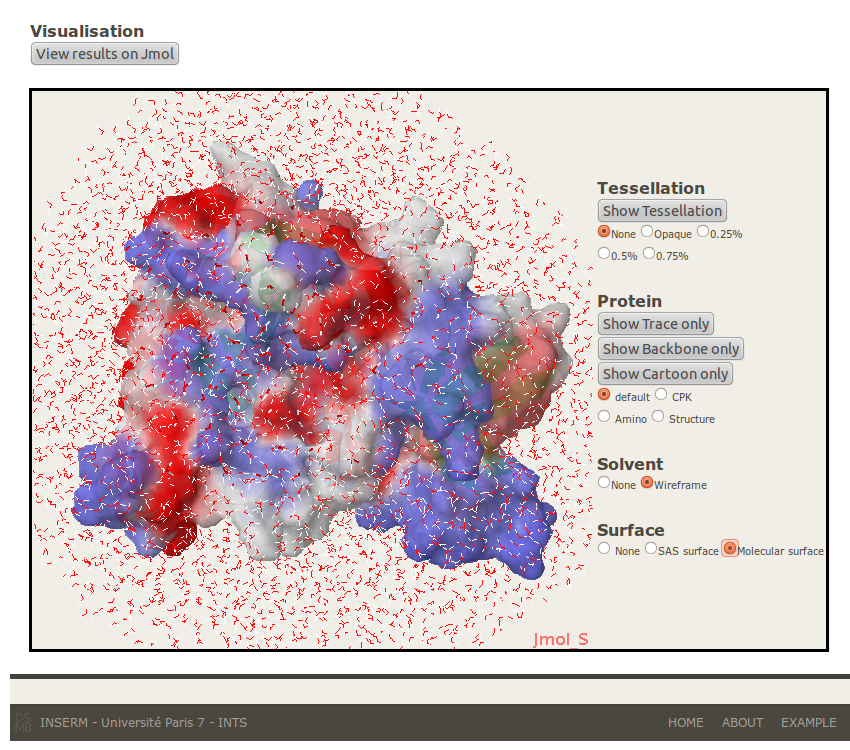
4- Surface: To visualize and compare the standard surface with the Laguerre one. Two kinds of surface can be displayed, ASA and Molecular. The surface is coloured with a scal (blue to red) according to the secondary structures.

Molecular Surface
B-Laguerre Tessellation and local Analysis
After downloading the zip file in the top of result page and unzipping, you get:
- contact (folder)
Contains all information on atom and residue contacts, and also the interface area used for residue accessibility (PIA).
- graphic (folder)
Containc python scripts to visualize the tessellation with PyMol.
- sol[pdb chain].pdat (file, formatted for VLDP)
Text file with information extracted from pdb file, used for VLDP.
- sol[pdb chain].pdb (file, solvated pdb file)
PDB file including added solvent.
- stratif (folder)
Contains text files and PyMol scripts describing the organization of the water network in layers.
- topo (folder)
Contains text files and PyMol script to analyse the porosity of the protein by calculating its surface topological genus.
- volarea (folder)
Contains all information about atom and residue volumes for the protein and water molecules.
Each text file is formatted with a header describing the columns content.
References
- Esque, J., Oguey, C., and de Brevern, A.G. (2010). A novel evaluation of residue and protein volumes by means of Laguerre tessellation. J. Chem. Inf. Model. 50(5):947 - 960.[pubmed]
- Esque, J., Oguey, C., and de Brevern, A.G. (2011). Comparative analysis of threshold and tessellation methods for determining protein contacts. J. Chem. Inf. Model. 51(2):493 - 507.[pubmed]
- Faure G, Bornot A, and de Brevern A.G. (2008). Protein contacts, inter-residue interactions and side-chain modelling. Biochimie 90(4):626 - 639.[pubmed]
- Poupon, A (2004). Voronoi and Voronoi-related tessellations in studies of protein structure and interaction. Curr. Opin. in Struct. Biol. 14:233 – 241.[pubmed]